Analyzing and Demo Trading of XRPUSDT using the Red Army Strategy
Background Image Edited on Canvas
Hi friends,
I remain your favorite crypto analyst in the person of @simonnwigwe from Nigeria 🇳🇬 and it is a great pleasure on my part to share with you all the analysis I did today on a new pair of crypto assets called the XRPUSDT.
It's another day of the week and we are here again to use yet another familiar strategy to analyse the pair of XRPUSDT. I'm sure everyone knows about the Red army strategy because I have used it here over and over again.
The strategy is always very simple to use. Firstly you need to have a portfolio and then select the coins you wish to be trading and have them added to the portfolio. In this strategy you don't need much technical analysis.
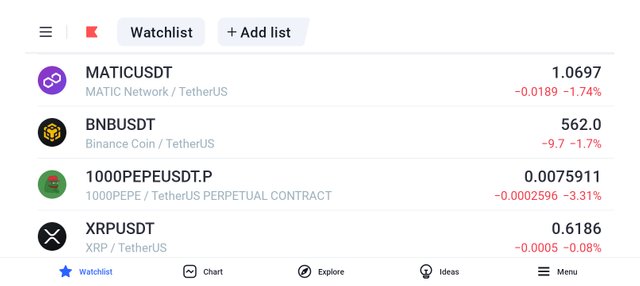
Just from the screenshot I have shared with us above, it's a portfolio I have set for myself in the TradingView web application where I do my learning via the technical analysis and demo trading.
Seeing the above screenshot alone tells you that there is blood on the street i.e the entire market is going bearish. When you see such in your portfolio, all you need to do is to immediately look for a good entry in any of your asset and then short the market.
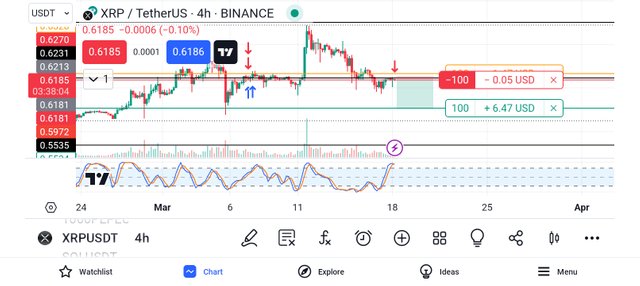
In our case today, we are going to be looking at the pair of XRPUSDT. Seeing the chart below, you will notice that the price was rejected in the resistance level as I have drawn it in the chart already.
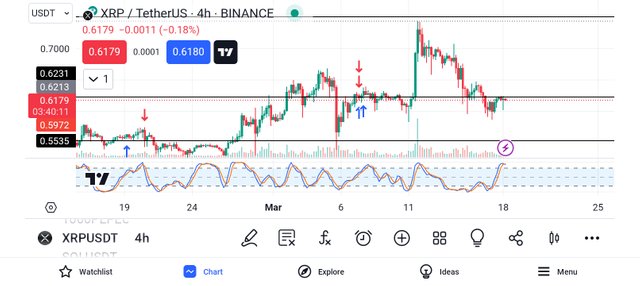
Also the indicator shows that the asset is already overbought and for that reason the price may be going downward towards the oversold region. That was another confirmation that made me take the trade.
With all the confirmation I have gotten i.e firstly, my portfolio shows red i.e the price of asset will be going down, the second confirmation was that price was rejected in the resistance level and finally the indicator has reached an overbought region which means price must definitely come down.
I decided to introduce my sell logo as you can see from the screenshot above. From the chart, the take profit is seen in the next support level and the stop loss is seen immediately above the resistance level.
From the risk management system of trading, the risk reward ratio for this trade is around 1:6 which means I'm risking 1% to gain 6% of the amount I put in this trade. So I only used what I can afford to loose even if it is a demo trade.
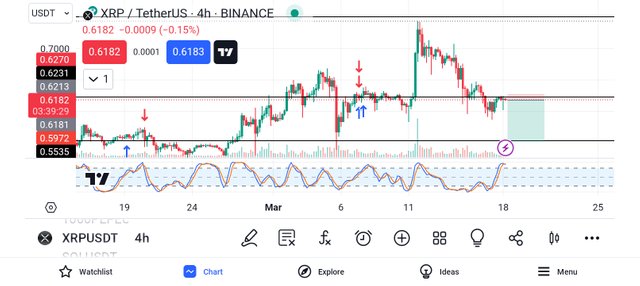
To properly keep track of the progress of the said pair of assets, I decided to introduce a demo trade to at least keep me on track and in check so that I will have a little emotion when the market goes in my favor or against me. See the screenshot below.
From the above screenshot, you will notice that the demo trade has been activated already. If the market goes as predicted, then I will be able to earn a total of 6.47 USD, and if the market goes against me for any reason I will lose 1.47 USD. This shows that it's a good risk-reward ratio if you ask me.
Finally, I also decided to go to the position side to get complete information on the market so that you all can see it more clearly. The details below talk about the points where I take my profit, my stop loss, and even the current price of the asset when I'm making the post.
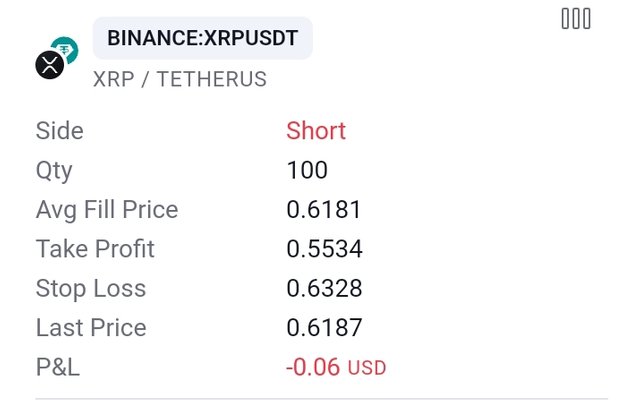
From the screenshot above, you will notice that the side is short (sell), the quantity is 100, the average fill price is 0.6181, the take profit level is at 0.5534, the stop loss is at 0.6328 and lastly the P&L at the moment is -0.06, that is all about the open order.
After a while, I decided to check back on the trade to see if the market was going in my favor or against me. Going through the chart I saw that the market did not respected my analysis and that is what gave us the result you can see from the screenshot below.
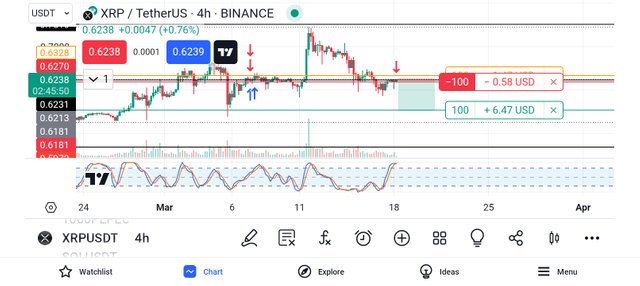
From the above screenshot, you will notice that the loss made is already at -0.58 USD which means our analysis is not in my favour at the moment. I will still hold on to the market and see the final movement of the asset because I'm confident that it will go my direction. So let's be patient as market will still go as predicted.
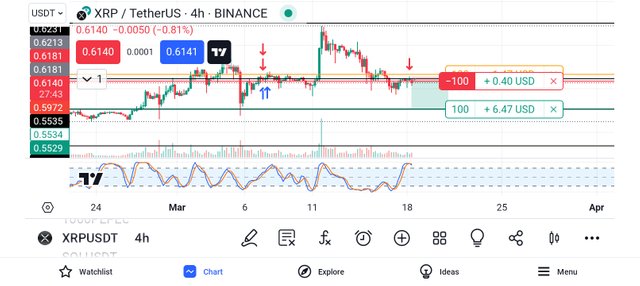
After some hours, I saw that a profit of about $0.40 USDT which means that the market later respected our analysis.
Conclusion
In analysis like this, the market may not go your direction immediately so all you need to do is to be patient and wait for the movement of the market in the direction you have predicted.
So you need not panic if you have properly set your stop loss on the trade. This is the main reason stop loss is very important. Even if you didn't set the take profit, always set your stop loss. So let's keep an eye on the trade and see how it goes.
Remember also that trading is like meditation, patience is the key. Always wait for the market to come to you and not for you to go to the market. Learn to identify your key support and resistance level and also trade with the trend and in that way, you will be a successful trader.
Finally, I want to thank you all for reading through my post today. If you have any questions or contributions, please do well to use the comment section of this post. See you all in my next publication.
Disclaimer: This post is made as an education and not investment advice. Digital asset prices are subject to change. All forms of crypto investment have a high risk. I am not a financial advisor, before jumping to any conclusions in this matter please do your research and consult a financial advisor.
NB: All images except otherwise stated are mine and taken from tradingview.com website
X-Share
Note:- ✅
Regards,
@jueco