Analyzing and Demo Trading of ETHUSDT using the support & resistance Strategy
Background Image Edited on Canvas
Hi everyone,
I remain your favorite crypto analyst in the person of @simonnwigwe from Nigeria 🇳🇬 and it is a great pleasure on my part to share with you all the analysis I did today on a new pair of crypto assets called the ETHUSDT.
Support and resistance Strategy is a strategy I apply almost everytime when analysing any pair of asset. No matter the strategy implored for an analysis, one of the key points to consider is the support and resistance level.
That being said, it is important we look at this strategy properly by applying it to a pair of ETHUSDT on a 4H timeframe. Let's see properly how this strategy works. Now let's consider the screenshot below and see how it goes.
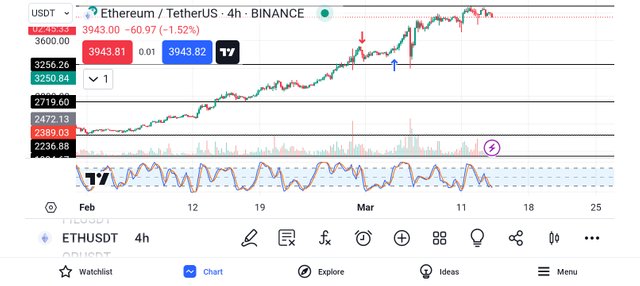
From the above screenshot, the points for support and resistance has been shown using the horizontal lines. We know that support level are level which the price cannot break down further i.e a point where price downward movement cannot move downward again.
In the case of the resistance level, we are looking at a point where the price of the asset can not move further upward i.e a stage where the upward movement of an asset it rejected. For a support and resistance level to be valid, prices must have been rejected like twice or thrice on that very level.
With that in mind, I have drawn these levels of support and resistance and I have also noticed the downward movement of the asset and that is why I decided to introduce my sell logo. From the screenshot below you can see it.
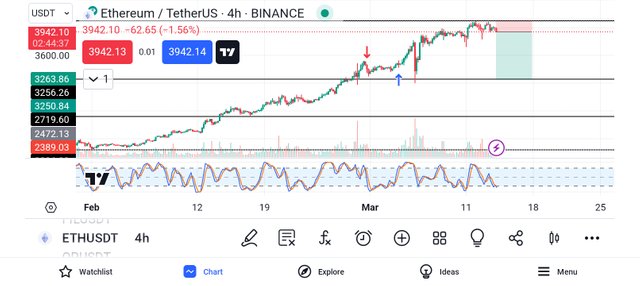
Based on the above screenshot, the sell logo shows that I was ready to take a profit when the price drops to the next support level and to get out of the trade if the market doesn't go my direction immediately when the price moves to the resistance level.
From the analysis, you will notice that the market risk management which I'm willing to take is around 1:6 risk reward ratio which is a good trade if you ask me. So let's go ahead to demo trade this setup and see what will come out from it.
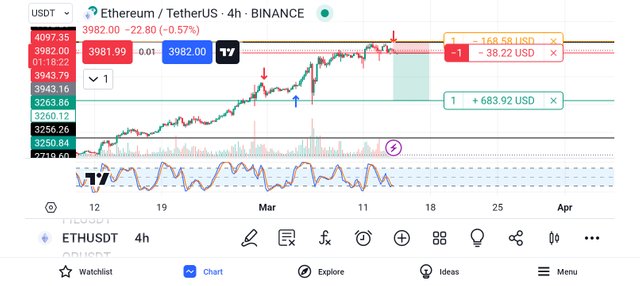
To properly keep track of the progress of the said pair of assets, I decided to introduce a demo trade to at least keep me on track and in check so that I will have a little emotion when the market goes in my favor or against me. See the screenshot below.

From the above screenshot, you will notice that the demo trade has been activated already. If the market goes as predicted, then I will be able to earn a total of 684.00 USD, and if the market goes against me for any reason I will lose 168.60 USD. This shows that it's a good risk-reward ratio if you ask me.
Finally, I also decided to go to the position side to get complete information on the market so that you all can see it more clearly. The details below talk about the points where I take my profit, my stop loss, and even the current price of the asset when I'm making the post.
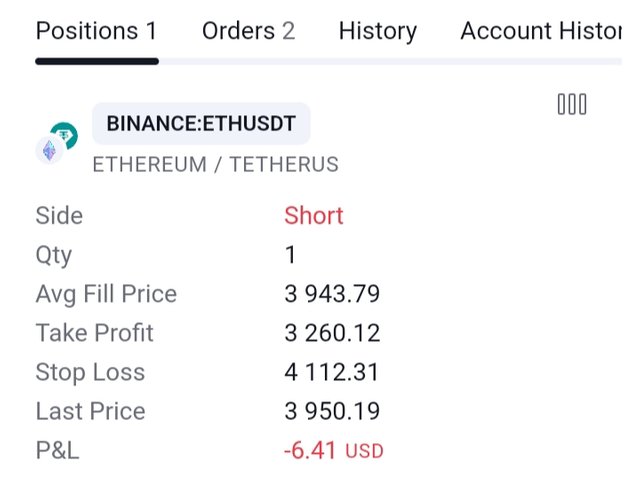
From the screenshot above, you will notice that the side is short (sell), the quantity is 1, the average fill price is 3943.79, the take profit level is at 3260.12, the stop loss is at 4112.31 and lastly the P&L at the moment is -6.41, that is all about the open order.
After a while, I decided to check back on the trade to see if the market was going in my favor or against me. Going through the chart I saw that the market did not respected my analysis and that is what gave us the result you can see from the screenshot below.
From the above screenshot, you will notice that the loss made is already at -38.22 USD which means our analysis is not in my favour at the moment. I will still hold on to the market and see the final movement of the asset because I'm confident that it will go my direction. So let's be patient as market will still go as predicted.
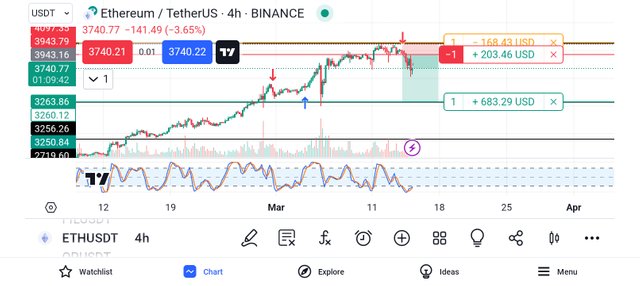
Checking through the trade the next day I saw that I was already on a profit of about 203.46 USD. This means that the analysis went in the desired direction.
Conclusion
Analyzing crypto asset using the support and resistance strategy is very easy and everyone needs to know where support and resistance are found in the chart. I have told us in my write ✍️ up above that for a support or resistance to be valid, prices must have rejected that point like twice or thrice or even more.
When you have this knowledge then you can go ahead to analyse your asset via that strategy so I believe everyone reading through my post today understand this fact. So let's continue looking at the market and see how the market plays out.
Remember also that trading is like meditation, patience is the key. Always wait for the market to come to you and not for you to go to the market. Learn to identify your key support and resistance level and also trade with the trend and in that way, you will be a successful trader.
Finally, I want to thank you all for reading through my post today. If you have any questions or contributions, please do well to use the comment section of this post. See you all in my next publication.
Disclaimer: This post is made as an education and not investment advice. Digital asset prices are subject to change. All forms of crypto investment have a high risk. I am not a financial advisor, before jumping to any conclusions in this matter please do your research and consult a financial advisor.
NB: All images except otherwise stated are mine and taken from tradingview.com website
X-Share
Note:- ✅
Regards,
@theentertainer