Analyzing and Demo Trading of DYMUSDT using the Green Army Strategy
Background Image Edited on Canvas
Hi everyone,
I remain your favorite crypto analyst in the person of @simonnwigwe from Nigeria 🇳🇬 and it is a great pleasure on my part to share with you all the analysis I did today on a new pair of crypto assets called the DYMUSDT.
Today just like every other day I have come again to analyse the pair of DYMUSDT with us all and I want to believe you have been enjoying the tutorial so far. In todays edition of the analysis we are looking at at the Green Army Strategy.
I want to believe that at this point we all know what I call the green Army here in the crypto market. For the sake of those who are new to my blog and can't go as far as digging through my previous post, I will explain briefly in the paragraph below.
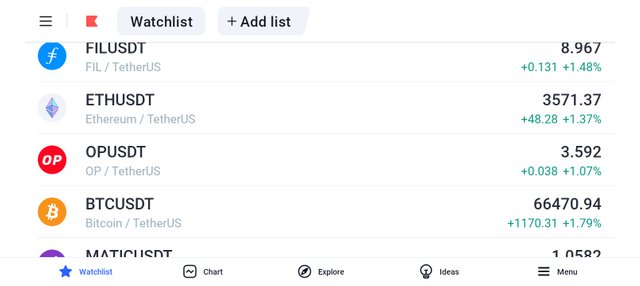
Green Army Strategy means checking through your portfolio as in the case of the screenshot above and seeing that all asset within your portfolio is greenish which means that all the asset are experiencing a bullish movement at that point and time.
When you see such, what comes to your mind is an opportunity to long or buy the market. Here you make money on both side i.e weather the market is moving upward or the market is going downward so it all depends on your prediction.
If you predict that the market will go up and it does, then you will make profit, similarly, when you predict that the market is going down and it does then you will also make profit.
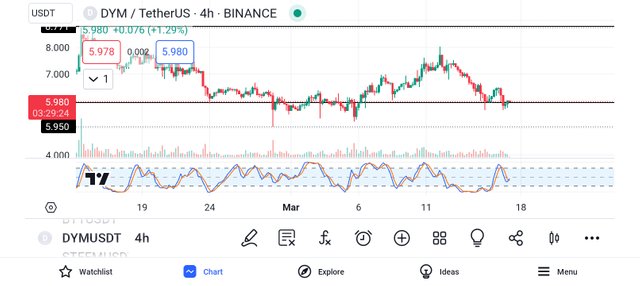
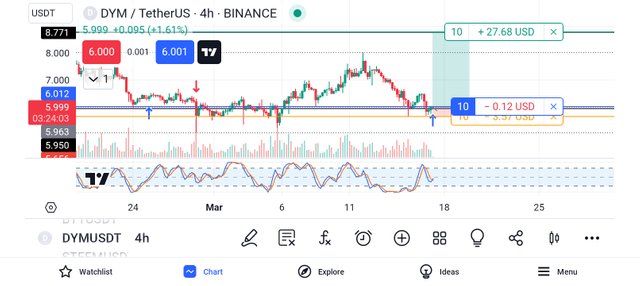
Seeing the market, I went into the chart as seen in the above screenshot. From the chart the level of my support and resistance has been drawn already. From the chart you will notice that the price of the asset was rejected at the support level twice and that is what made me to make a decision of taking a long on the trade.
Based on that observation and the fact that my entire portfolio is going in green, I decided to take advantage of the rejection and the market immediately by introducing my buy logo as you can see from the screenshot below.
From the above screenshot, you will notice that the buy logo has been added and a take profit level is set to the next resistance level. The stop loss is set below the last bullish candle in the chart which means that the risk reward ratio of the trade is around 1:10.
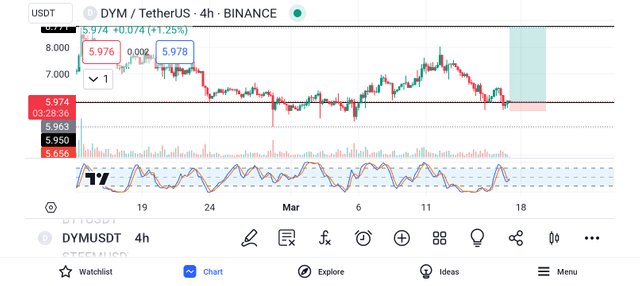
To properly keep track of the progress of the said pair of assets, I decided to introduce a demo trade to at least keep me on track and in check so that I will have a little emotion when the market goes in my favor or against me. See the screenshot below.
From the above screenshot, you will notice that the demo trade has been activated already. If the market goes as predicted, then I will be able to earn a total of 27.68 USD, and if the market goes against me for any reason I will lose 3.57 USD. This shows that it's a good risk-reward ratio if you ask me.
Finally, I also decided to go to the position side to get complete information on the market so that you all can see it more clearly. The details below talk about the points where I take my profit, my stop loss, and even the current price of the asset when I'm making the post.
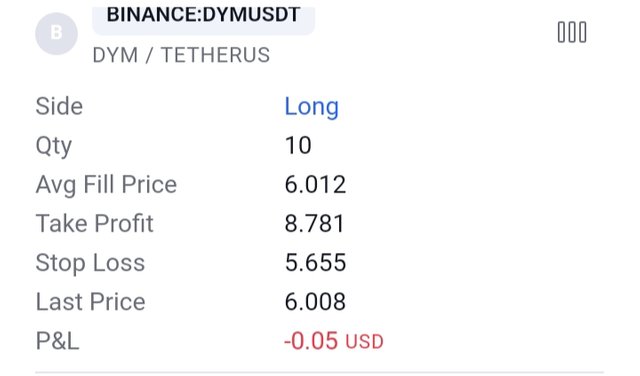
From the screenshot above, you will notice that the side is long (buy), the quantity is 10, the average fill price is 6.012, the take profit level is at 8.781, the stop loss is at 5.655 and lastly the P&L at the moment is -0.05, that is all about the open order.
After a while, I decided to check back on the trade to see if the market was going in my favor or against me. Going through the chart I saw that the market did not respected my analysis and that is what gave us the result you can see from the screenshot below.
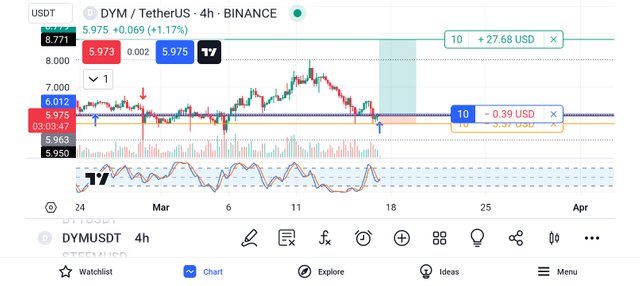
From the above screenshot, you will notice that the loss made is already at -0.39 USD which means our analysis is not in my favour at the moment. I will still hold on to the market and see the final movement of the asset because I'm confident that it will go my direction. So let's be patient as market will still go as predicted.
Conclusion
The market is not going as predicted at the moment but that doesn't mean I should exit the market and that is the essence of putting a stop loss in any of your trade.
While trading the financial markets, you need to risk what you can afford to lose and that is why I encourage us all to always go for a demo trade before going into a real life trade and always use your stop loss.
Remember also that trading is like meditation, patience is the key. Always wait for the market to come to you and not for you to go to the market. Learn to identify your key support and resistance level and also trade with the trend and in that way, you will be a successful trader.
Finally, I want to thank you all for reading through my post today. If you have any questions or contributions, please do well to use the comment section of this post. See you all in my next publication.
Disclaimer: This post is made as an education and not investment advice. Digital asset prices are subject to change. All forms of crypto investment have a high risk. I am not a financial advisor, before jumping to any conclusions in this matter please do your research and consult a financial advisor.
NB: All images except otherwise stated are mine and taken from tradingview.com website
X-Share
Note:- ✅
Regards,
@theentertainer