Analyzing and Demo Trading of BNBUSDT using the Red Army Strategy
Background Image Edited on Canvas
Hi guys,
I remain your favorite crypto analyst in the person of @simonnwigwe from Nigeria 🇳🇬 and it is a great pleasure on my part to share with you all the analysis I did today on a new pair of crypto assets called the BNBUSDT.
The red army strategy is a strategy we are all familiar with I guess because I have used it over and over again in some of my various post. So for the sake of those who have no idea about this strategy I will still want to explain briefly on it.
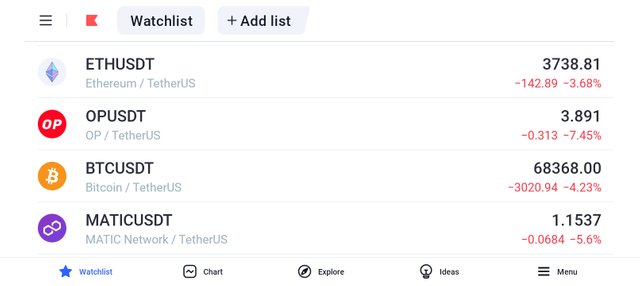
Now let's consider the screenshot above, from the screenshot, you will notice that the market via my portfolio is red which means that the red army has taken over the market. Seeing that, all that comes to mind as a crypto trader is an opportunity to short the market.
Whenever we see the market this way, every trader looks for opportunities to short the market. So based on that I decided to look for a good pair which I came in contact with the pair of BNBUSDT as you can see from the screenshot below.
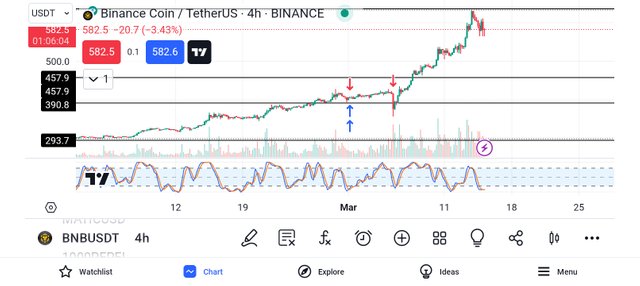
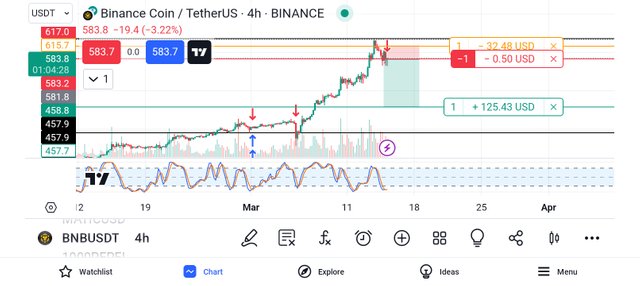
From the screenshot above, you can see that the levels of support and resistance has been taken into consideration and also we see that the market is coming downward which means our prediction at this moment will be that the market will come downward.
With that in mind, I did the little analysis by checking the indicator and seeing the potential of the market still coming down and I decided to open a short order by introducing my sell logo as you can see from the screenshot below.
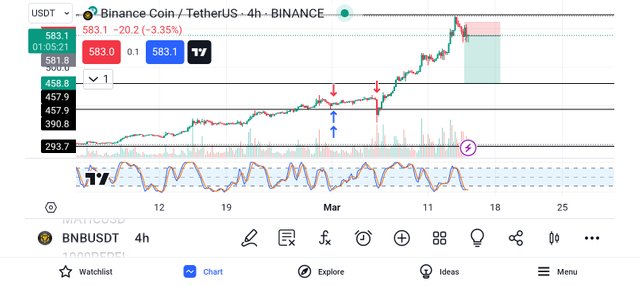
From the above screenshot, the take profit is kept at the next support level and the stop loss is seen above the last bearish candle, this is to help me minimise loss and maximise profit. So with these, the risk management used on the trade can be said to be a good one since the ratio of profit to loss is high.
So by merely looking at the trade, you will notice that the risk reward ratio of the market is around 1:6 which is a very good risk reward ratio if the market goes in my favour. So let's see how the analysis goes by taking a step further i.e introducing the demo trade.
To properly keep track of the progress of the said pair of assets, I decided to introduce a demo trade to at least keep me on track and in check so that I will have a little emotion when the market goes in my favor or against me. See the screenshot below.
From the above screenshot, you will notice that the demo trade has been activated already. If the market goes as predicted, then I will be able to earn a total of 125.43 USD, and if the market goes against me for any reason I will lose 32.48 USD. This shows that it's a good risk-reward ratio if you ask me.
Finally, I also decided to go to the position side to get complete information on the market so that you all can see it more clearly. The details below talk about the points where I take my profit, my stop loss, and even the current price of the asset when I'm making the post.
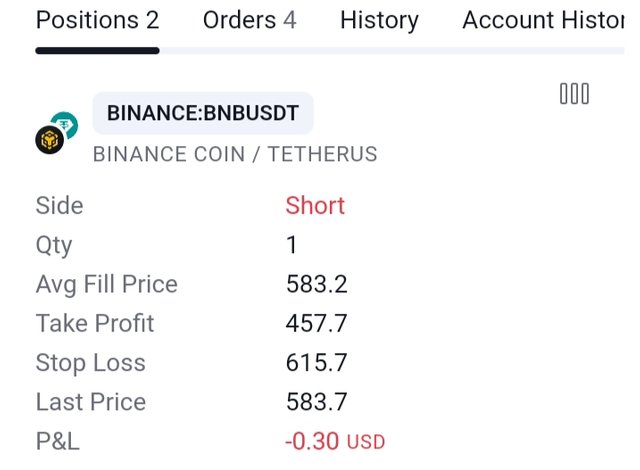
From the screenshot above, you will notice that the side is short (sell), the quantity is 1, the average fill price is 583.2, the take profit level is at 457.7, the stop loss is at 615.7 and lastly the P&L at the moment is -0.30, that is all about the open order.
After a while, I decided to check back on the trade to see if the market was going in my favor or against me. Going through the chart I saw that the market respected my analysis and that is what gave us the result you can see from the screenshot below.
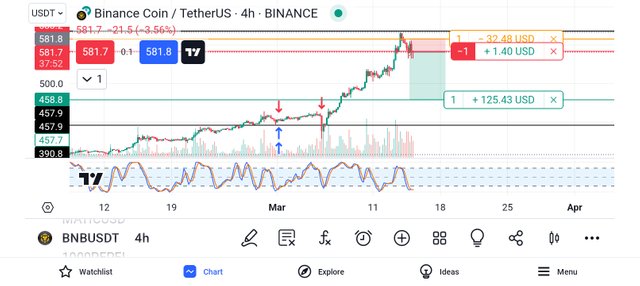
From the above screenshot, you will notice that the profit made is already at +1.40 USD which means our analysis is in my favour at the moment. I will still hold on to the market and see the final movement of the asset because I'm confident that it will go my direction. So let's be patient as market will still go as predicted.
Conclusion
Analyzing the crypto market is very easy when you understand the basic concepts or strategies. The green or red army strategy is a strategy are used often to scalp a trade and in doing so one has to be watchful of the market and exit the market when a certain percentage of profit is made.
As you can see from the screenshot above, we are already on profit and I will hold on to the market for a bit longer and see how it goes. Until then let's keep our eyes and fingers across and see how the market goes.
Remember also that trading is like meditation, patience is the key. Always wait for the market to come to you and not for you to go to the market. Learn to identify your key support and resistance level and also trade with the trend and in that way, you will be a successful trader.
Finally, I want to thank you all for reading through my post today. If you have any questions or contributions, please do well to use the comment section of this post. See you all in my next publication.
Disclaimer: This post is made as an education and not investment advice. Digital asset prices are subject to change. All forms of crypto investment have a high risk. I am not a financial advisor, before jumping to any conclusions in this matter please do your research and consult a financial advisor.
NB: All images except otherwise stated are mine and taken from tradingview.com website
X-Share
Note:- ✅
Regards,
@jueco