Analyzing and Demo Trading JOEUSDT using support and resistance strategy
Background Image Edited on Canvas
Hello, my dear crypto lovers, it's your crypto analyst in the person of @simonnwigwe from Nigeria 🇳🇬. It's another day of the week and I'm delighted to be here again today to share with you all a very interesting analysis I did on the pair of JOEUSDT on a 4H timeframe using the support and resistance strategy.
It is my earnest desire that at the end of this publication, you will learn something new in the crypto space and also how to use it when the time is right. Remember we are already in the bull season and we need all the knowledge necessary to triumph in this very season.
One thing I have noticed in my few months of coaching and trading is that a lot of traders don't know how to draw a proper support and resistance line using a simple horizontal line and that has been a major challenge to them which also has made it difficult for them to use it in analysis.
Today in this article, I will want to share an idea on how you can draw a perfect support and resistance line using a horizontal line in the trading view platform. Now let's get started. Please pay more attention here and learn.
To draw a perfect support and resistance line, you will need to use a better timeframe say 1D or 1W timeframe. Though I do my analysis using the 4H timeframe I always draw my support and resistance from a higher timeframe.
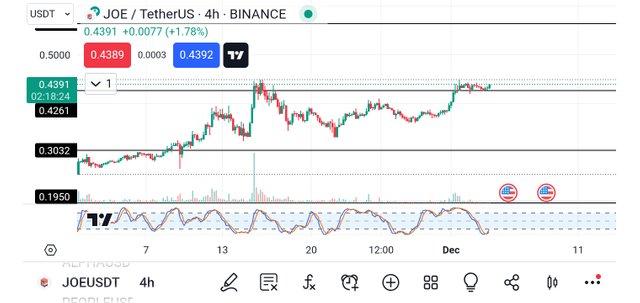
From the above image, I used the top-down analysis strategy i.e. I drew my support and resistance on a 1D timeframe and then I went down to 4H to see how the market looked. The price as you can see is trending above the support level which means it has the possibility of going bullish.
The price if you check you will notice that it has been in range for a while and the last bullish candle as you can see from the screenshot is gathering a lot of momentum which you can see from the volume, that alone was convincing.
I immediately introduced my buy logo as you can see from the screenshot below. With carefulness, I used very proper risk management while placing the buy logo in the chart as you can see below.
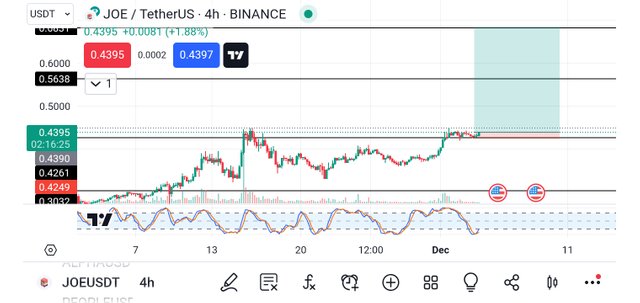
From the above chart, you will notice that the stop loss is right below the support line and the take profit is seen at the second resistance level giving us two take profit opportunities. Good risk management is what I implored here as you can see above.
Having done that, I decided to keep appropriate track of the trade to see if I was winning or losing, and if I was winning what would be added to my account, and if I was losing what would be added to my account.
That was where the demo trade came into play. Since I'm still developing my skills, I decided to enter the market as you can see from the screenshot below.
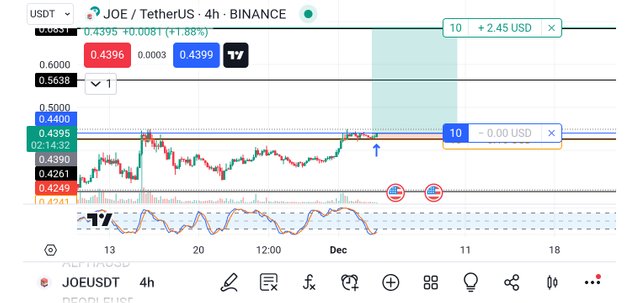
Based on the above screenshot, you will notice that if the market moves in my direction, I will be making a profit of 2.45 USD and if the market goes against me I will be losing 0.16 USD. This is nice management if you ask me because the risk-reward is around 2:10.
Finally, I also took a screenshot of the position that I opened for the trade as it contains all the information you need to know about the trade I took. The screenshot below shows the open position.
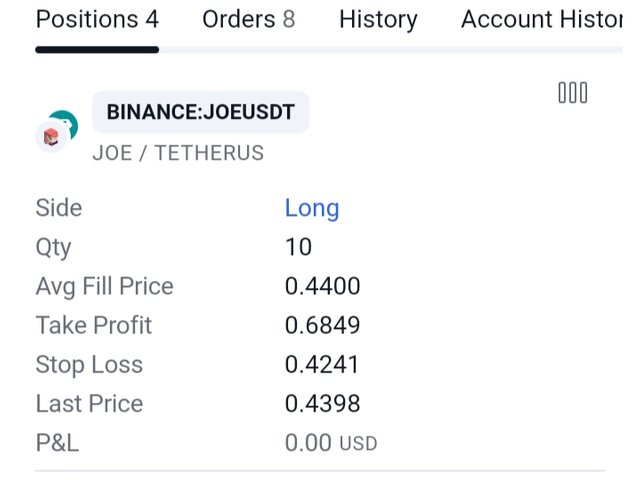
From the screenshot above, you will notice that the side is long (buy), the quantity is 10, the average fill price is 0.4400, the take profit level is at 0.6849, the stop loss is at 0.4241 and lastly the P&L at the moment is 0.00, that is all about the open order.
After some hours of placing my demo trade, I went back to check how the market was going and I noticed that the market was already respecting my analysis and moving in my predicted direction as you can see from the screenshot below.
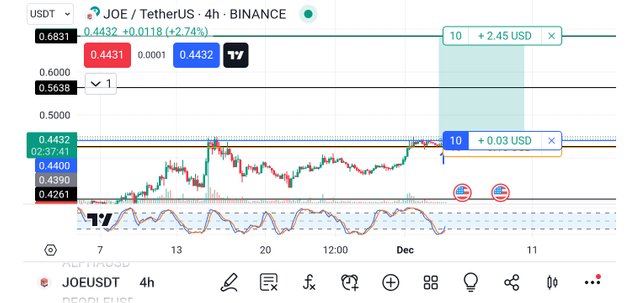
From the screenshot, you can see that I have already made some profit of about 0.03 USD, and the market I believe will continue in an upward direction for some time I believe.
Conclusion
The ability to know the true support and resistance level in my trade gives you an upper hand in knowing when to enter or exit the market. As I have said earlier, you can only get the right points using the top-down analysis method.
Remember also that trading is like meditation, patience is the key. Always wait for the market to come to you and not for you to go to the market. Learn to identify your key support and resistance level and also trade with the trend and in that way, you will be a successful trader.
Finally, I want to thank you all for reading through my post today. If you have any questions or contributions, please do well to use the comment section of this post. See you all in my next publication.
Disclaimer: This post is made as an education and not investment advice. Digital asset prices are subject to change. All forms of crypto investment have a high risk. I am not a financial advisor, before jumping to any conclusions in this matter please do your research and consult a financial advisor.
NB: All images except otherwise stated are mine and taken from tradingview.com website
X-Share
Note:- ✅
Regards,
@theentertainer