Analyzing and Demo Trading FXSUSDT using the Red Army strategy
Background Image Edited on Canvas
Greetings dear friends and welcome once again to my blog. It's another to analyze the crypto market and I'm delighted to be your teacher today. Seeing continuously in the comment section of my post that I need to include more details so that everyone including newbies will get the knowledge on how they can analyze the market themselves has made me take more time to do the analysis and also the explanation will be broader for your understanding. I want to believe that this article today will be one of the best you will be reading on the platform today.
Red Army is a strategy used when the market is looking bearish. This means that if the list of the crypto assets you have kept in your portfolio all looks red then you will say the red armies are in control of the market. When the Red Armies are in charge of the market, all you need to do as a trader is always sell the market.
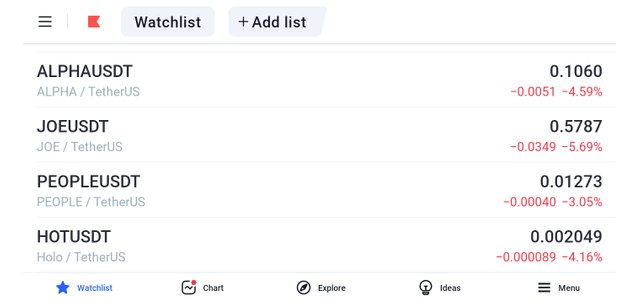
From the screenshot above, you can see the list of my portfolio everything is red meaning the red armies are in charge of the market. When you see this, you don't need to be told that you are too short on the market. I have said here over and over again, as a trader, you must always trade in the direction of the trend.
Do not trade against the trend else you will lose your money. What this means is that if the market is going down, always sell the market, and if the market is going up always buy the market. Do not long during a downtrend and do not short during an uptrend.
Seeing the market, I don't need much technical analysis, all I need is to select a coin and then look for a good entry to short the coin. One of the criteria for selecting a coin to be short or long as the case may be is to check for the coin that has not dropped too much and shows more potential of dropping.
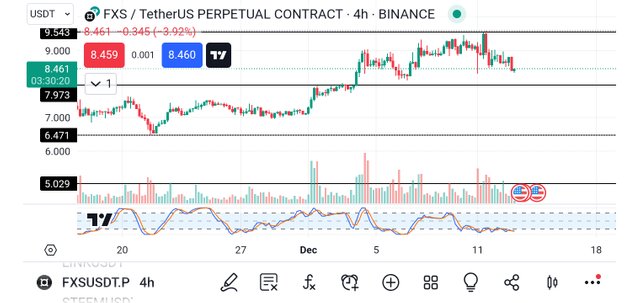
From the chart above, I selected the pair of FXSUSDT and then I used the 1D timeframe to see the bigger picture which allowed me to draw a proper support and resistance line as you can see from the screenshot above, I moved down to the 4H timeframe to see the chart more closely.
After carefully looking at the chart I noticed that the downtrend hasn't been much and it means there is still a tendency for the asset will drop again. I checked the market volume and I noticed that the sell bar is growing stronger and that was what led to my decision to introduce the sell logo as you can see in the screenshot below.
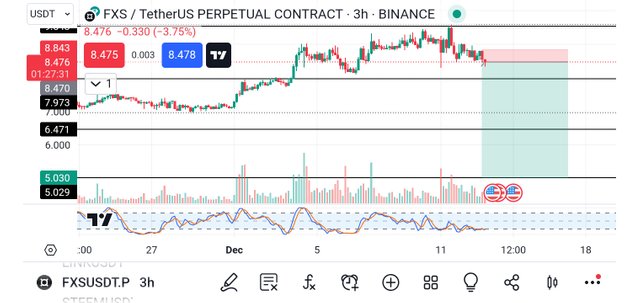
From the above screenshot, I placed the sell logo and then had my stop loss above the previous bearish candle, and the take profit was pushed down to the 3rd support level. It is important to mention here that I went down to a lower timeframe of 3H again to take my entry as you can see from the above chart.
I did that because the lower the timeframe the better my entry so that I could get something little in the market and if I desire to exit the market I can also do so with the little I have. Having put the sell logo, I now activated the demo trade as you can see from the image below.
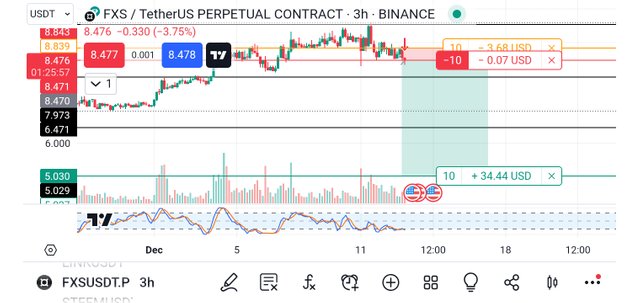
From the above chart, you will notice that if the market doesn't respect my analysis and decides to go against me, I will be using the sum of 3.68 USD as seen in the screenshot above. In the same way, if the market moves in my direction, I will be earning 34.44 USD.
In my opinion, that is a very good risk management strategy that everyone will love to implore in his or her trade always because it is indeed a profitable technique.
Finally, I also took a screenshot of the position that I opened for the trade as it contains all the information you need to know about the trade I took. The screenshot below shows the open position.
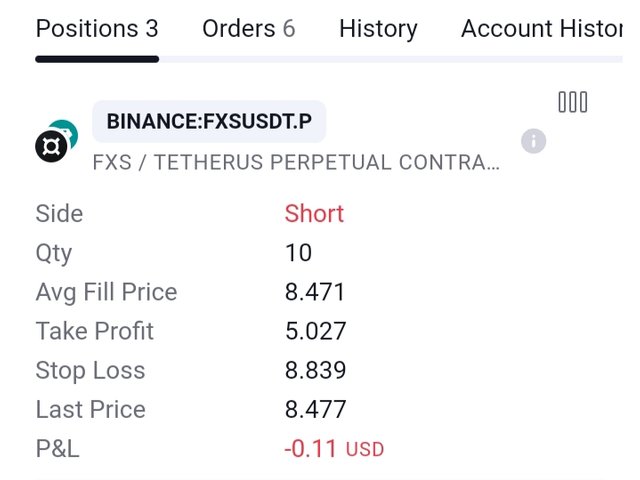
From the screenshot above, you will notice that the side is short (Sell), the quantity is 10, the average fill price is 8.471, the take profit level is at 5.027, the stop loss is at 8.839 and lastly the P&L at the moment is -0.11, that is all about the open order.
Conclusion
As a trader, always trade in the direction of the trend. In the case of the above analysis, we saw that the land is red which means that only selling opportunities are allowed and we took advantage. So we traded in the direction of the trend we didn't counter-trade or trade against the trend. That is what every profitable trader do always.
Remember also that trading is like meditation, patience is the key. Always wait for the market to come to you and not for you to go to the market. Learn to identify your key support and resistance level and also trade with the trend and in that way, you will be a successful trader.
Finally, I want to thank you all for reading through my post today. If you have any questions or contributions, please do well to use the comment section of this post. See you all in my next publication.
Disclaimer: This post is made as an education and not investment advice. Digital asset prices are subject to change. All forms of crypto investment have a high risk. I am not a financial advisor, before jumping to any conclusions in this matter please do your research and consult a financial advisor.
NB: All images except otherwise stated are mine and taken from tradingview.com website
Dear @simonnwigwe ,
We appreciate your active participation and contributions to our community. To ensure a positive environment for all members, we have implemented a set of guidelines to maintain respectful and constructive discussions while upholding community guidelines.
This is an interesting analysis on fxsusdt you have shared, keep sharing quality post in the community
Now Engage, Connect, and Inspire Each Other to Reach New heights.
Thank You.
X-Share