Analyzing and Demo Trading FILUSDT using the double-bottom strategy
Background Image Edited on Canvas
Hello guys,
It's your favourite Steemian and your crypto analyst that goes with the name @simonnwigwe from Nigeria 🇳🇬. I'm delighted to be here once again to drop a beautiful technical analysis which I did on the pair of FILUSDT. It's an analysis which was done on a 4H timeframe and you will love to check it.
As you all know, there are many strategies which help one to be able to determine the directional movement of the market and based on that, we will be considering the double-bottom strategy. It's a good one that the chart we have today shows this strategy before and the next will confirm it.
From the chart below, I have marked out the first region of a double bottom and after the breakout of the neckline, we saw that the market moved upward as indicated by the upward arrow in the image below.
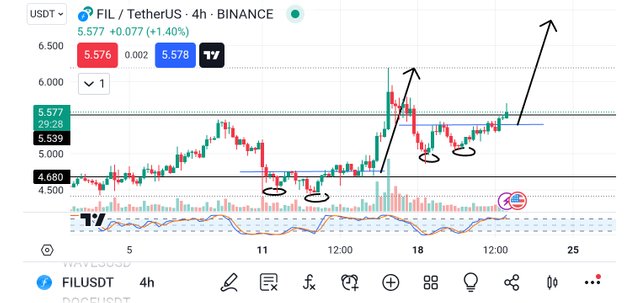
Whenever we give a double bottom, all you need to expect is a pump in the price of the asset. We have seen a good example from the above chart. This same scenario has presented itself once again to us in the second part of the chart and as you can see from the image, the neckline has already been broken and we are looking out for another pump.
I also have marked the region we call the double bottom from the chart and since I'm confident of the pattern, all I did was to introduce the but logo as seen in the screenshot below. From the buy logo, you can see very good risk management taken into consideration.
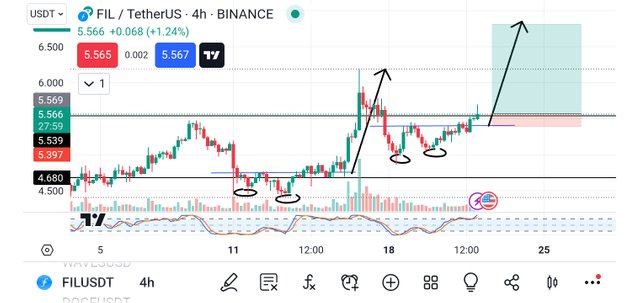
Based on the above image, you can see that the stop loss is kept immediately below the neckline and the take profit is seen at the next resistance level. From my observation, the trade risk reward reward is about 2:10 which is a nice trade anyone would like to take.
To keep track of the movement of the asset, I waited for the 4H candle to close and it closed bullish so I immediately took the buy entry as you can see from the screenshot below. This entry is to keep me aware of my gains and losses if the market goes in my favour or against me for any reason.
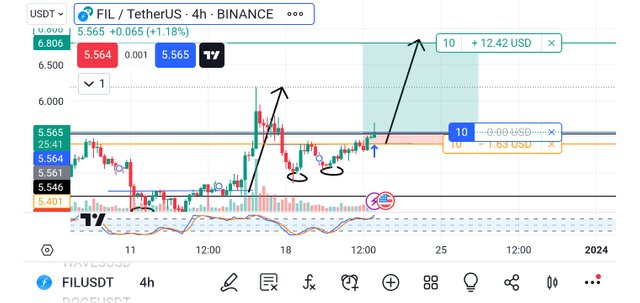
Based on the screenshot above, you will notice that if the market goes in my favour, I will be making a profit of 12.42 USD but if the market goes against me, I will be losing 1.63 USD which is a very good risk compared to the reward if you ask me.
In trading, you always take into consideration both said i.e. profit and loss as the market doesn't always go as predicted. Always use a small stop loss like the one I have used on this trade and then manage your risk so that you don't get your account blown off.
Finally, I also took a screenshot of the position that I opened for the trade as it contains all the information you need to know about the trade I took. The screenshot below shows the open position.
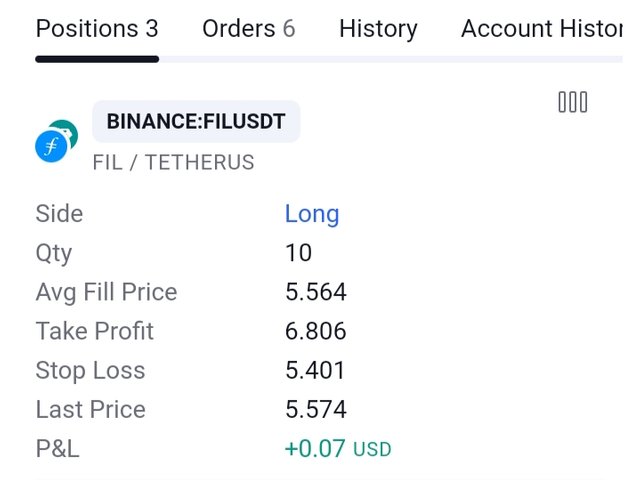
From the screenshot above, you will notice that the side is long (buy), the quantity is 10, the average fill price is 5.564, the take profit level is at 6.806, the stop loss is at 5.401 and lastly the P&L at the moment is +0.07, that is all about the open order.
After about an hour, I decided to check through the trade before posting the analysis and I discovered that the market was already in a big profit as I had predicted earlier. From the screenshot below you can see how progressive the market is moving.
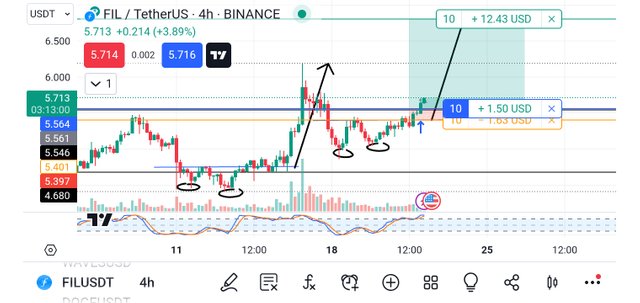
Based on the above screenshot, you will notice that a total of +1.50 USD profit has been added to the trade already because the trade respected the strategy which we have used here. The double-bottom strategy is one of the most effective strategies in crypto and you also can take advantage of it at all times.
Conclusion
From the analysis above, we have seen that the double-bottom strategy works like magic hence whenever you see such a signal, wait for a perfect entry which must usual before or after the break of the neckline before entering the market.
I have presented two examples on the chart and the results obtained as well for your understanding. Do your analysis and then make your trading decision as well.
Remember also that trading is like meditation, patience is the key. Always wait for the market to come to you and not for you to go to the market. Learn to identify your key support and resistance level and also trade with the trend and in that way, you will be a successful trader.
Finally, I want to thank you all for reading through my post today. If you have any questions or contributions, please do well to use the comment section of this post. See you all in my next publication.
Disclaimer: This post is made as an education and not investment advice. Digital asset prices are subject to change. All forms of crypto investment have a high risk. I am not a financial advisor, before jumping to any conclusions in this matter please do your research and consult a financial advisor.
NB: All images except otherwise stated are mine and taken from tradingview.com website
X-Share
Dear @simonnwigwe ,
We appreciate your active participation and contributions to our community. To ensure a positive environment for all members, we have implemented a set of guidelines to maintain respectful and constructive discussions while upholding community guidelines.
This is an interesting strategy you have used for the analysis of FILUSDT, keep sharing quality post in the community
Now Engage, Connect, and Inspire Each Other to Reach New heights.
Thank You.