Analyzing and Demo Trading BTCUSDT using the double-top strategy
Background Image Edited on Canvas
Greetings dear friends and welcome to my blog. It's another day of the week to talk about crypto analysis and I do hope you will learn something new from today's trade of BTCUSDT demo trade which uses the double-top strategy. I have shared this strategy before but it will be good to revisit it for the sake of those who have no idea about it.
A double top is a sign that the market will go downward and the confirmation is always when the market breaks the neckline of the double top. I didn't mark this area in this chart but I want to believe we all know it.
The market has been bullish for the past few days but about a few hours ago we saw a sharp dump in the crypto space which caused one of the highest liquidations in recent times. From the chart below, you will notice the sharp dump of BTC which also happened to almost all the altcoins.
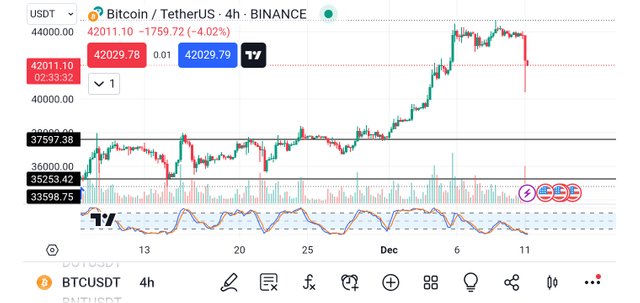
From the image above, BTC was moving in a range until the sharp dump which broke the neckline of the double top formed by the coin. The dump was indeed a massive one and I guess the dump is not over yet hence the need for taking this trade today.
You all know that most altcoins follow the BTC movement hence as BTC is dumping they are also dumping and as BTC is pumping they are also pumping. With that in mind, I decided to analyze BTC to know if the market is going to continue downward or upward
Based on my observation, I noticed that the dump is still in the market hence I decided to short the market. In doing that, I have introduced the sell logo as you can see in the screenshot below. After the long dumping candle closed another bearish candle came out and from the volume it shows that it may go more bearish.
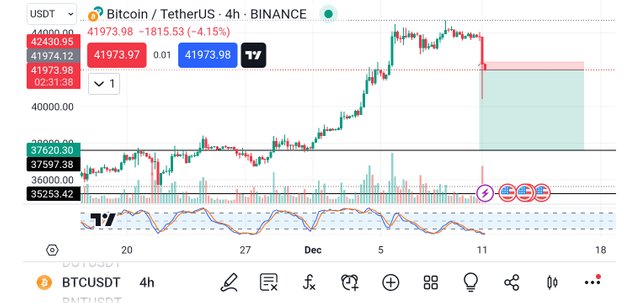
From the above image, you will notice my trade setup using the sales logo. For the sake of proper risk management, I decided to place the stop loss right above the bearish candle which is forming already and the take profit at the next support level as you can see.
The take profit level is the level the market has reached before with that sharp move before it was rejected. If the sellers come with more power they may be able to push the market downward and I see such a possibility hence the reason for the trade.
To keep track of the trade, I decided to introduce the demo trade to it as you can see from the screenshot below.
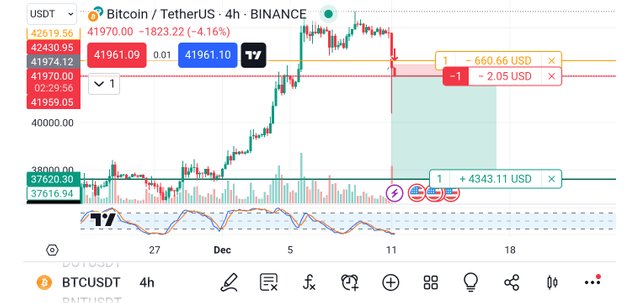
From the above chart, if the market goes in my favor, I will be making a profit of 4343.11 USD whereas if it goes against me I will be making a loss of 660.66 USD. This is a good trade if you ask me because the risk is not much compared with the profit.
Finally, I also took a screenshot of the position that I opened for the trade as it contains all the information you need to know about the trade I took. The screenshot below shows the open position.
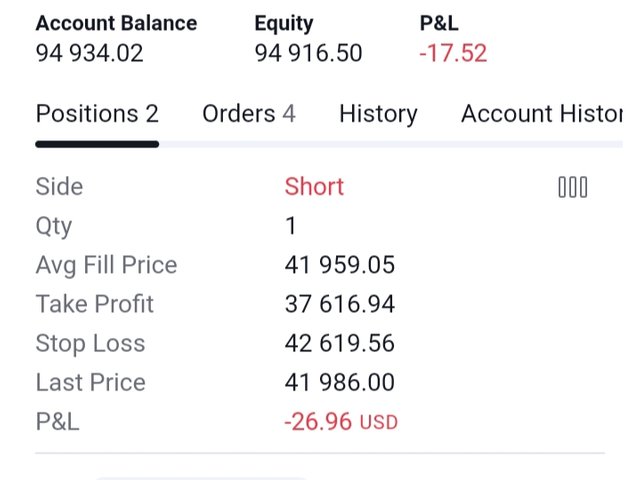
From the screenshot above, you will notice that the side is short (Sell), the quantity is 1, the average fill price is 41959.05, the take profit level is at 37616.94, the stop loss is at 42619.56 and lastly the P&L at the moment is -26.96, that is all about the open order.
Conclusion
The market most times is manipulated by the whales to trap small traders with little capital like you and I. The downtrend movement of these coins you see today didn't take 5 minutes and that has caused a lot of accounts to perish. Most exchanges had to close the traders so that they could minimize the loss for their customers and their selves as well.
Always remember to put a stop loss on all your trades and never trade on the cross margin because that leads to liquidation more easily. Let's always keep an eye on our trade and use proper risk management.
Remember also that trading is like meditation, patience is the key. Always wait for the market to come to you and not for you to go to the market. Learn to identify your key support and resistance level and also trade with the trend and in that way, you will be a successful trader.
Finally, I want to thank you all for reading through my post today. If you have any questions or contributions, please do well to use the comment section of this post. See you all in my next publication.
Disclaimer: This post is made as an education and not investment advice. Digital asset prices are subject to change. All forms of crypto investment have a high risk. I am not a financial advisor, before jumping to any conclusions in this matter please do your research and consult a financial advisor.
NB: All images except otherwise stated are mine and taken from tradingview.com website
Dear @simonnwigwe ,
We appreciate your active participation and contributions to our community. To ensure a positive environment for all members, we have implemented a set of guidelines to maintain respectful and constructive discussions while upholding community guidelines.
Kindly help to indicate some information on your chart, so newbies can learn from your trading strategy quickly
Now Engage, Connect, and Inspire Each Other to Reach New heights.
Thank You.
X-Share