Ehterium Market Analysis & Price Prediction || 24 March, 2024 || Steem Alliance
.png)
Assalamu Alaikum friends,
Hope everyone is well and healthy. Everyone knows that the cryptocurrency market has now entered the bull season. Bitcoin halving is still 28 days away. However, before this halving, Bitcoin has touched its all-time high and is taking a slight down market correction. Due to this behavior of Bitcoin, Ethereum or alt coins are also creating some kind of support resistance. I will share in today's blog, Ethereum market analysis and price prediction. Without wasting time let's start:-
While Bitcoin managed to hit its all-time high, Ethereum did not. All-time high of the last 2 years only managed to hit. A week ago Ethereum hit $4093, the best in the past 2 years. But Ethereum could not hold its prize for long. Within 3 days the price of Ethereum dropped below $4000 and a kind of panic sale was observed. But, this panic cell could not last long either.
When investors realized that these things were due to panic, they stopped selling and the price of Ethereum started to stabilize between $3200 and $3400 and has been staying in this price zone for the past few days. In today's blog I will analyze the 4 hour, 1 day and 1 week timeframes. Hope you will like this analysis and analyze it with proper reasoning.
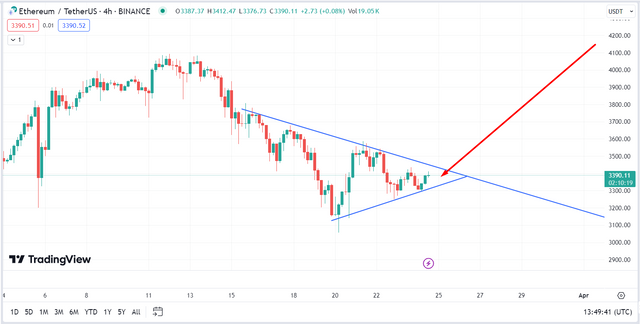
In this timeframe we notice that the candle that Ethereum has formed is the Bearing Pennat. When such a pattern is formed, the candles always dump through the bearing. And the prize starts to drop. So this 4 hour timeframe shows that Ethereum may dump for a short period of time. But, it may not be for a permanent period.
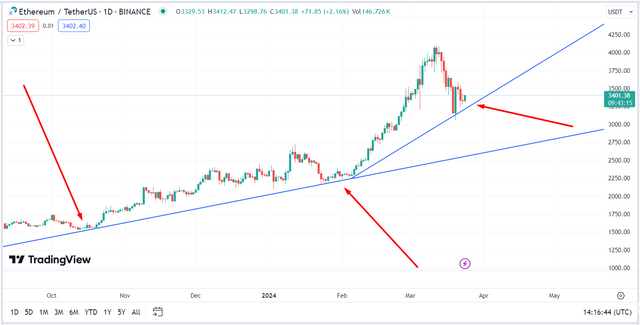
In the above screenshot, we can see that Ethereum has formed a rising edge pattern on the 1-day timeframe and is moving its price accordingly. In the first case, once Ethereum makes a rising edge, the price goes up by long pumping and then back down by a little dump. This move creates a new rising edge pattern. So I expect Ethereum to touch the support line for the first time and give a long pump again.
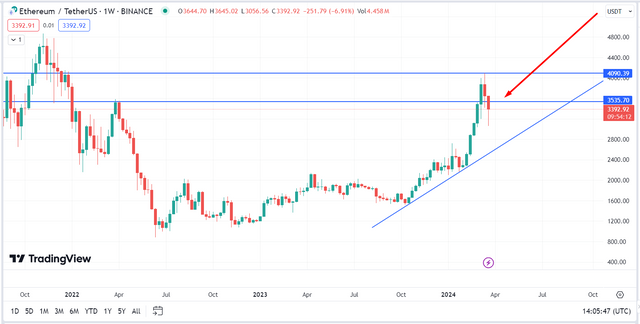
There are many things to consider for this timeframe. First, Ethereum's 1-week candle is in a bullish movement with a rising edge. After being in a bullish movement, the price started to fall due to a slight dump. But this candle is once again going back to bullish by pumping its price. Second, in the zone marked above, there is a very strong support. Ethereum can stabilize above this support if it breaks. Then Ethereum can easily be seen between $5000. This is my prize prediction.
VOTE @bangla.witness as witness

OR

Thanks
https://twitter.com/sagor1233_tfc/status/1771918090562846937
You have done a very nice analysis. According to the previous candle, your analysis is 100% correct. If the market does not manipulate. Thank you for sharing such a beautiful analysis with us. Many will benefit from your post.