Topdown Analysis Of DOTUSDT Using Support And Resistance Strategy And RSI Indicator As Confluence
Hello great minds,
With a heart filled with joy, I humbly come before you all today to share my analysis on the native token of the polkadot community.
I believe you are all doing great in the community and are enjoying your activities in the community as you join hands with us in furthering the steemit promotion work across various social media platform.
It is really great to work with you all, and now we will be learning a little about polkadot community.
Polkadot is understood to be an open source sharded multi chain protocol, that aims to secure and connect a network of specialized blockchain, thus aiding the cross-chain transfer of any type of asset or data, which in turn improves the interoperabilitily nature of the blockchain.
Polkadot was created to provide a foundation for web3, which is known as a decentralized internet of blockchain.
Please continue with us as we examine it's analysis.
ANALYSIS USING SUPPORT AND RESISTANCE STRATEGY
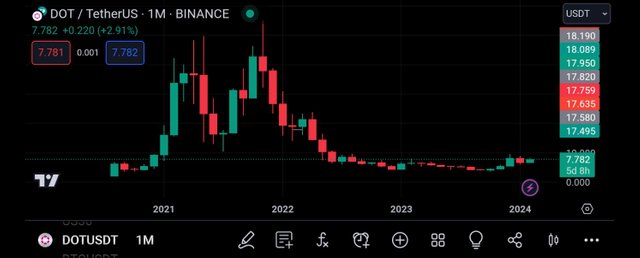
The screenshot above is that of DOTUSDT on the monthly timeframe, and as seen above, the chart consist of green and red candles.
From the monthly timeframe above, it is quite easy for the market trend to be detected, and we can say that the overall trend of the pair DOTUSDT is bearish.
And in other to progress with my analysis, I have to move to the weekly timeframe, where I can identify key market levels that will influence my trading decisions.
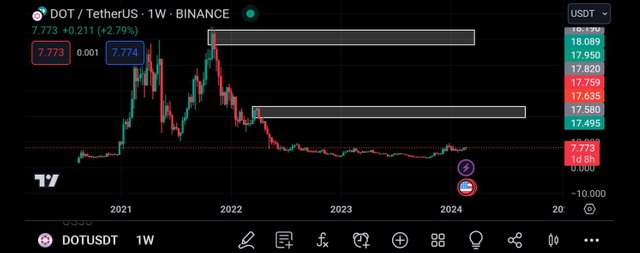
Moving to the weekly timeframe, I could see more candlestick than the monthly timeframe, and this is expected.
I then progressed by identifying strong levels on the price chart, these levels upon which the market will react on.
And as seen above, I spotted 2 key levels which are functioning as strong resistance level to the market, and whenever price gets to this level again, I expect to see a rejection to the downside.
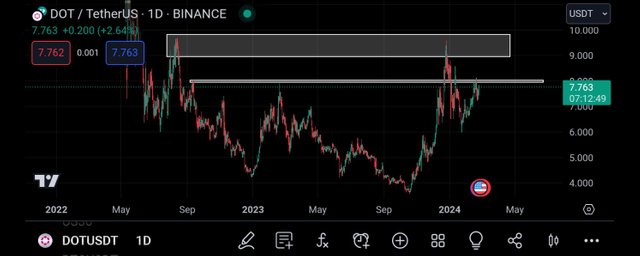
I then progressed to the daily timeframe for more market analysis.
And on this timeframe, I can see noise in the market, I can see the sellers and buyers trying to push price to their preferred direction.
I then looked carefully and was able to spot a key level in the market, and this levels are functioning as resistance levels to the market price.
These levels are valid levels because they have been previously tested by price and have been respected.
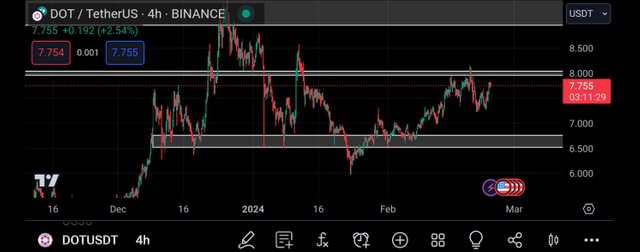
Then I moved to the 4hr timeframe, and on this timeframe, I could see more market analysis.
I could see clearly the drive of the bulls and the bears and the impact it is having on market price.
And from the screenshot above, we can see that the price is approaching a resistance level, and when it gets to this level, I expect to see a rejection candle, and when this appears, I intend to join the market to the downside.
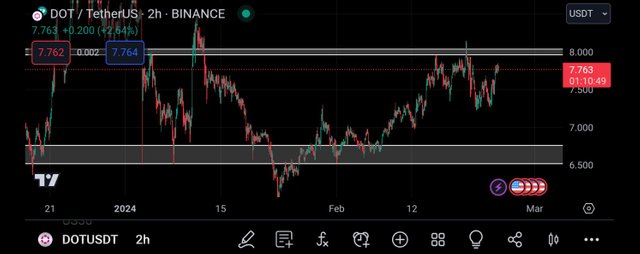
Moving to the 2hr timeframe, I could see market activities more clearly.
I could see the struggle between the buyers and sellers but I noticed that the buying pressure was becoming more than the selling pressure.
From this, I noticed that the market is gradually approaching the resistance level I marked out, and when this happens, I intend to take the market to the downside.
With this bearish bias, I decided to search for confluence making use of rsi indicator.
CONFLUENCE USING RELATIVE STRENGTH INDEX INDICATOR
The operation of the rsi indicator is no news to us in the community.
The rsi Indicator is used to detect overbought and oversold market regions.
And when an overbought market is detected, it is a bearish trend reversal signal, and when an oversold market is detected, it can be interpreted as a bullish trend reversal signal.
With this understanding, I will be introducing the charts
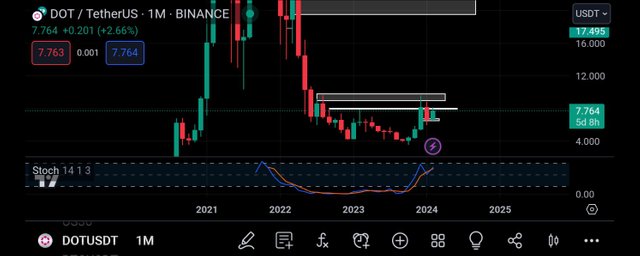
Beginning with the monthly timeframe, we can see that the rsi has crossed above the 80% level, and when this happens, the market is said to be overbought.
An overbought market is a technical signal telling that the market is about to be bearish in nature, it is signaling bearish trend reversal.
And this is in confluence with our analysis using support and resistance strategy.
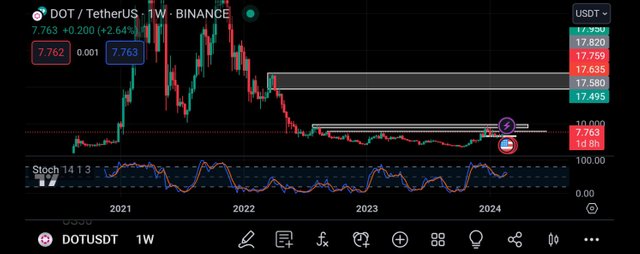
Moving to the weekly timeframe, I also noticed that the market is being overbought, and this is a bearish trend reversal signal.
Just as my analysis using support and resistance tells, I expect to see the market experience a bearish move.
Then I decided to move to the 2hr timeframe to search for entry into the market.
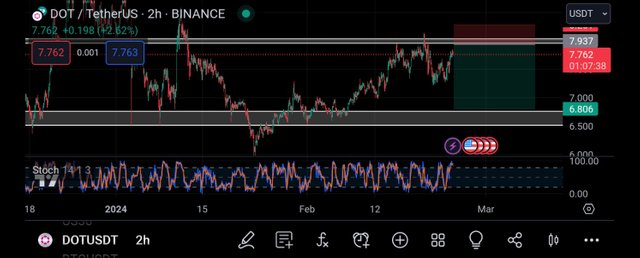
Moving to the 2hr timeframe, I also noticed that the market is being overbought, and this is a bearish trend reversal signal.
I then decided to join the market from the closest resistance level, just as seen above.
And my take profit was placed on the closest support level of the market.
CONCLUSION
Polkadot is a good crypto project in the cryptospace, and also it's token is one of the tokens with good value in the cryptospace.
And explain above is my live analysis of it's chart.

https://twitter.com/JuecoYoung/status/1761480804339765344