Top Down Analysis Of HIVEUSDT Using Support And Resistance Strategy And RSI Indicator As Confluence
Hello great minds,
It is a wonderful opportunity to come before you all today to discuss with you on an important issue in the cryptospace.
Today is a beautiful day and I will be sharing my analysis with you all on a crypto project in the cryptospace.
I will be sharing my analysis on HIVEUSDT and before I do that, allow me use this medium to extend my greetings to every member of this community.
I trust you are all doing perfectly fine and are enjoying your activities in the community as you join hands with us in the promotion work.
The token hive is not a new token to us, it is the native token of hive blockchain and I will be sharing my analysis of it.
ANALYSIS USING SUPPORT AND RESISTANCE STRATEGY
I mostly make use of support and resistance strategy for my analysis of the cryptomarket and this has been playing well for me over the years.
With the support and resistance strategy, I can spot effective entry levels into the market and also, I can identify the market trend.
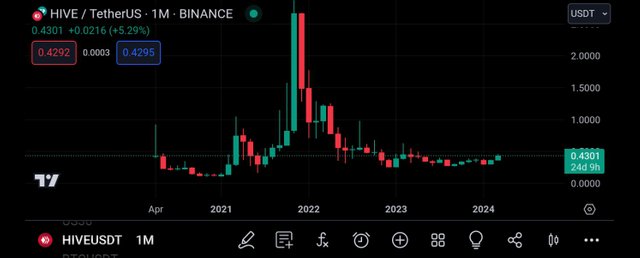
I began my analysis from the monthly timeframe, a timeframe I love to make use of as it helps me to accurately identify the trend of the market.
And from the above screenshot, we can easily see that the market is in a downtrend, consisting of lower lows and lower highs.
And we can also notice that there is a lesser noise in the market, as all candles formed here took a time period of 1month.
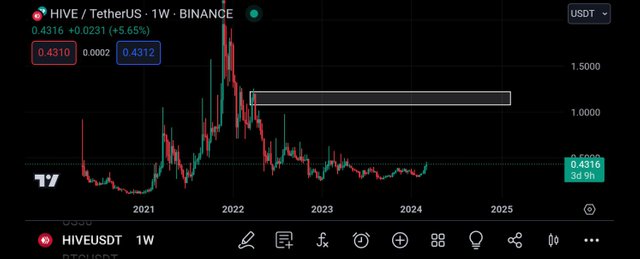
Moving to the weekly timeframe, I continued my analysis and I noticed that there are more candles on this timeframe than on the monthly timeframe.
Then I proceeded to identify key levels that the market is most likely to react to
And I then I found a strong resistance level that has been previously respected by market price.
And it is expected that when the market gets to this level, it will be rejected to the downside.
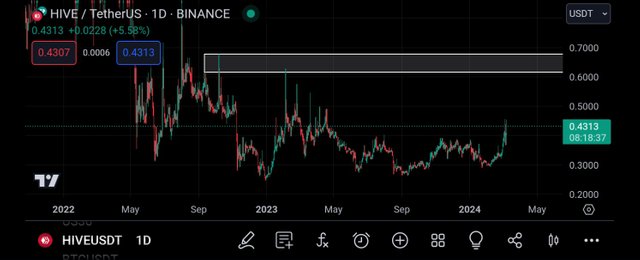
Moving lower to the daily timeframe for more market analysis.
I noticed more candles on the price chart, I can see the struggle between buyers and sellers in the market.
And with this, I carefully located another resistance level which have been tested and respected by market price.
And when the market gets to this level, it is expected to be rejected to the downside.
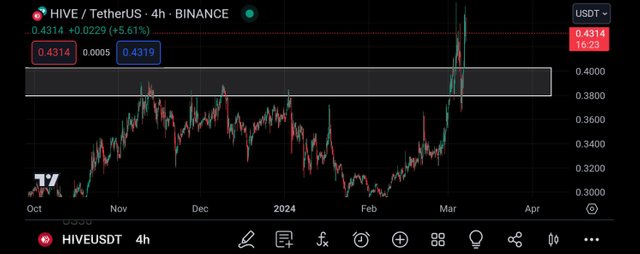
Moving to the 4hr timeframe, I could see the little structures of the market clearly.
I could see how the buyers and sellers struggle to drive price to their preferred direction.
And when I looked very carefully, I could see a resistance level in the market.
This level has been tested and respected severally by market price but this time, the market has broken above this level.
This implies that this level is now a support level to the price.
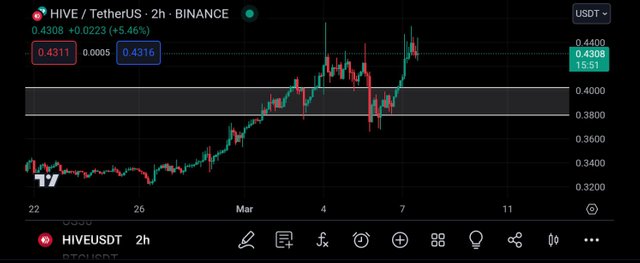
And as such, I came to the 2hr timeframe to get a clearer view of the market.
And on this timeframe, I can see that the market has broken this level and I can see rejection candles, which implies that the market is about to retrace to retest the broken resistance level.
With my bullish bias, I decided to make use of rsi indicator to serve as a confluence to my analysis.
CONFLUENCE USING RELATIVE STRENGTH INDEX INDICATOR
The rsi indicator is a technical tool that is used to detect oversold and overbought market regions.
When an overbought region is detected, the market is about to experience a bearish move, and when an oversold region is detected,it can be seen to be a bullish trend reversal signal.
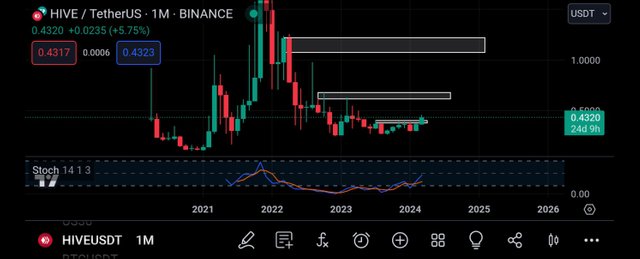
Applying the rsi indicator to the monthly timeframe, I can see that the market is being oversold.
And this can be confirmed as we see the rsi cross below the 20% line.
And an oversold market is known to be a bullish trend reversal signal to traders, and this is in alliance with our analysis using support and resistance strategy.
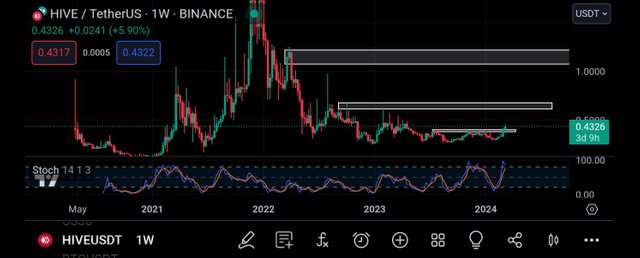
Moving to the weekly timeframe, I noticed that the market was in an overbought region, and this is indicating a bearish trend reversal.
As seen above, the rsi has crossed above the 80% line, and this is a bearish trend reversal signal.
With this, I moved to the 2hr timeframe to search for an entry into the market.
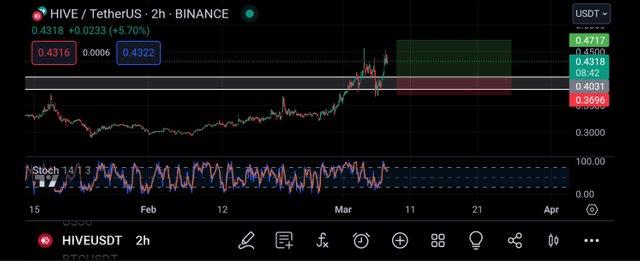
On the 2hr timeframe, I noticed that the market is being overbought and the market is very likely to retrace.
Then I decided to place my entry on the support level of the market price.
And my take profit was placed in a way that I will get a risk to reward ratio of 1:3.
CONCLUSION
Hive is the native token of hive blockchain, just as STEEM is the native token of steem blockchain.
And today, I have shared my analysis in this token, I expect to see the momentary buy of the market.
Thank you, friend!


I'm @steem.history, who is steem witness.
Thank you for witnessvoting for me.
please click it!
(Go to https://steemit.com/~witnesses and type fbslo at the bottom of the page)
The weight is reduced because of the lack of Voting Power. If you vote for me as a witness, you can get my little vote.
https://twitter.com/JuecoYoung/status/1765854718494982649