What you should know about Directional Movement Index (DMI)
Friend today let's discuss about "directional movement index (DMI)" which is an important indicator for checking the direction of an asset. Here in this, you will get to learn more about the DMI and what it is composed of.
Directional Movement Index (DMI)
This is an inductor that has been in existence for a long which ever since it was developed by J.Waelles Wilder Millions of traders have been using it to know the overall market direction of the price of the asset you are analyzing in the financial markets.
Tradingview
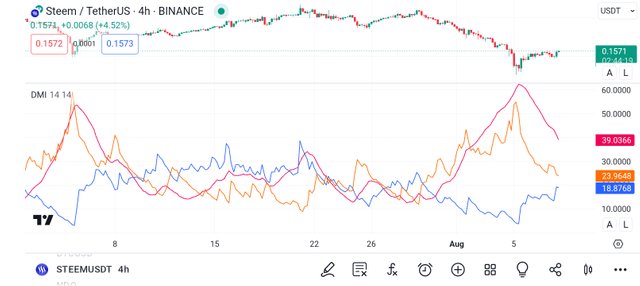
The question most people ask is how can one know the direction that an asset is moving towards, well this is what the DMI is been developed for. DMI is an indicator that can help you to where an asset is moving towards by comparing the previous price high price and the low price of the asset. When you take a look at the DMI you will see that it is made up of three (3) different lines. To understand what the lines are let's call them the components of DMI and talk about them.
Components of DMI
Tradingview
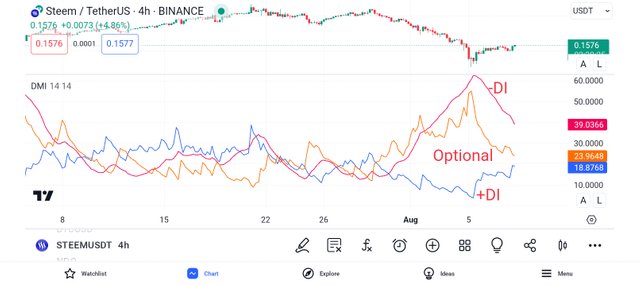
Friend looking at the above image in which the DMI is been applied you will see that it is composed of three (3) lines which are categorized as:
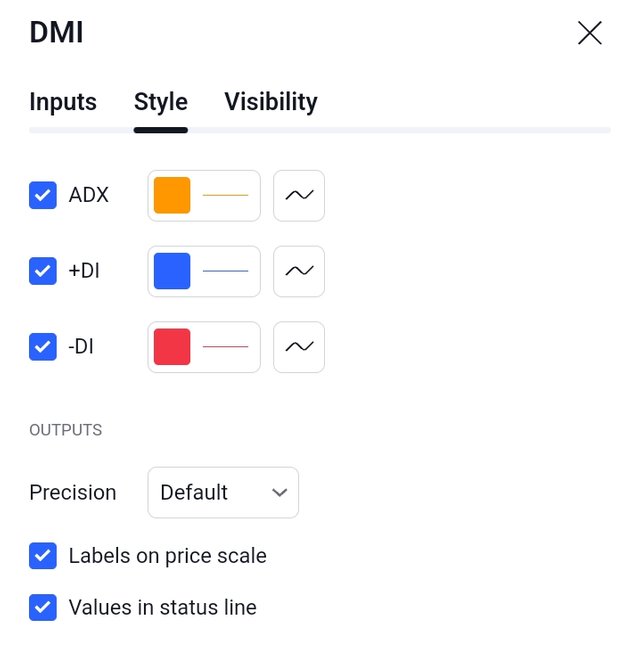
The Positive directional movement index line (+DI)
The negative directional movement index line (-DI)
The optional line.
The positive (+DI) line is the line blue line which is the line that represents an uptrend movement in the market, whereas the negative (-DI) line, is the red line that represents a downward movement in the market. The optional line is the line that represents the difference between the positive and the negative lines.
Reading
Tradingview
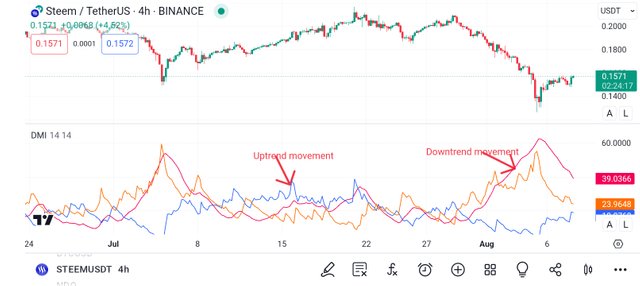
Remember what we have said earlier that the blue 🔵 line is the positive line (+DI) that represents an upward movement, if you see that the positive (+DI) line is above the negative (-DI) line which is the line color in ♥️ red, you should know that the market is moving in an uptrend as buyers interest is more than that of sellers.
Tradingview
As for the negative (-DI) red ♥️ line, if you see that it is above the positive (+DI) blue line, you should know that the market is moving in a downtrend which means sellers' interest is more than that of buyers. As an experienced trader, you can open a buy or sell order when you have seen that the two lines have crossover with each other.
Observe the above image and tell me what you see, now from the image you can see how the +DI crosses above the -DI which signals the beginning of an uptrend in the market. Now, a strong uptrend movement is when the +DI is completely crossing above the -DI whereas a strong downward movement is when the -DI is crossing above the +DI.
Calculation
DMI is very easy to calculate and all you have to do first is to know the difference between the previous high, the current high, and also the current low of the price of the asset you are analyzing.
To this, if the previous high is greater in value, a variable +DI will be set to the current High, and a variable -DI will then be set at 0.
Also, if the current low is greater, the -DI will be set to low and +DI will the be set to 0. Now in a situation where the two values are then equal (=) or if there is no trend at the high or low side, both values will then be set to 0.
Disclaimer
We have concluded our discussion about the directional movement index which we said is an indicator that shows you the direction of the price of an asset. Please note that this post is written as an educational content.
Thank you, friend!


I'm @steem.history, who is steem witness.
Thank you for witnessvoting for me.
please click it!
(Go to https://steemit.com/~witnesses and type fbslo at the bottom of the page)
The weight is reduced because of the lack of Voting Power. If you vote for me as a witness, you can get my little vote.
https://x.com/AkwajiAfen/status/1821420958978023428
Note:- ✅
Regards,
@theentertainer