What you should Know About Accumulation and Distribution Indicator
As a crypto trader, you will always be eager to know the current price and future price of an asset to know when to buy or when you are to sell to avoid being trapped in the market.
With the help of accumulation and distribution which we are going to discuss in this very post, you will be able to analyze the buying pressure and selling pressure of whatever cryptocurrency that you wish to trade. For a better understanding, accumulation, and distribution have been discussed separately so you can understand better.
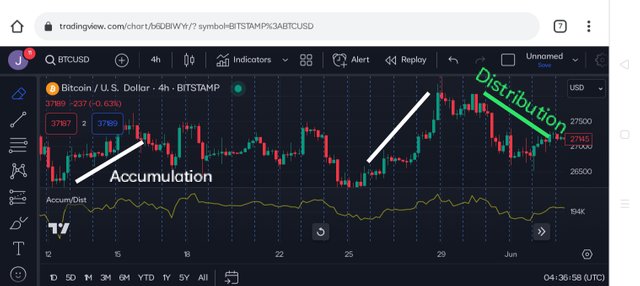
Accumulation
As a trader there at times were you keep on buying one particular cryptocurrency to have it in a large quantity to sell it and make a profit. Now, accumulation is the stage where investors and traders keep buying a particular asset in large quantities to build up their portfolio.
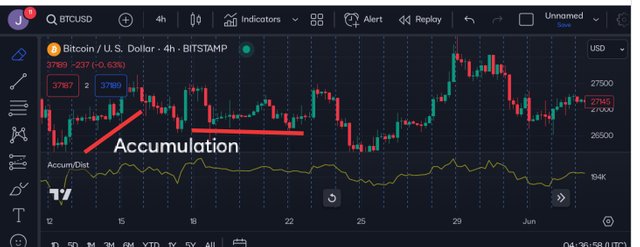
In a simple meaning, my dear friend accumulation is all about you buying (acquiring more assets) for yourself. It occurs when buying pressure is more than selling pressure, due to excess demand for the asset in the market. Because of too many demands. Accumulation is mostly carried out by institutional investors and crypto whales who usually enter the market with large amounts of capital.
Distribution
Distribution is the opposite of accumulation and it is when selling pressure is higher than the buying pressure because of the large quantity people are selling. In distribution institutional investors and traders who have bought a large amount of a particular asset usually start selling their asset for profit.
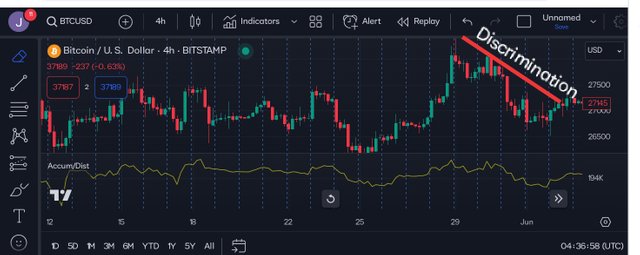
In a distribution stage due to the influence of sellers in the market what you will see when launching the chart of the same asset that sellers are in control you will see a downtrend momentum both in the line of the A/D. If buyers are the people that dominate the market it is an upward trend that you will see in the chart.
In every market, be it financial, stock exchange, or crypto market, it is good for you to know how supply and demand work, if not you will be left in the dark because understanding the two terms can help you know the future movement price of whatever asset you want to trade.
How A/D indicator works.
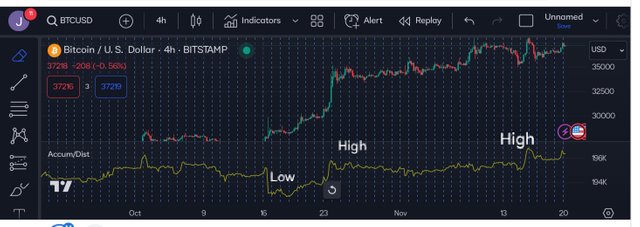
Looking at the above chart you will see the A/D indicator on it which is the yellow line that is making a lower low and a higher high following the price chart of BTC/USD. From the chart, the A/D indicator line is moving in close relation with the price of BTC/USD, which means as the price of BTC/USD went low the A/d also went low, as the price moves up that is how the A/D lines also move up.
Based on the chart you have seen, means A/D indicator is used to predict the future direction of an asset and provide a better edge for you to enter the market. To this;
When you see that the price of the asset and the A/D line have both made a high higher and a higher low, then you should know that the market is likely to continue moving in an uptrend.
But when you see that the price of the asset and the A/D line have both made a low high and a lower low, then you should know that a downtrend move is likely to continue.
Conclusion
A/D indicator is an indicator that you can use and know the volume force that is behind the price movement of whatever asset you want to trade on or you are already trading on. This post is only an educational post and not an investment advice.
https://x.com/AkwajiAfen/status/1726478260152959101?s=20
Hello @josepha,
Please update your topic, it's not complete, something is missing.
Corrected thanks.