Squeeze Momentum Indicator (SMI): What You Should Know
Are you a trader who is looking for a clear picture of the market to know if there is a price change or not, if you are then I will say the squeeze momentum indicator which we have discussed here is the right indicator for you to use. Let's take a quick look at what SMI means.
| Squeeze Momentum Indicator (SMI) |
|---|
A good man named John Carter who spent most of his life trading the financial market is the person who created this indicator called "Squeeze Momentum Indicator. It is a volatility indicator that helps you to know when the price of an asset has increased or decreased in the market so you can quickly take action.
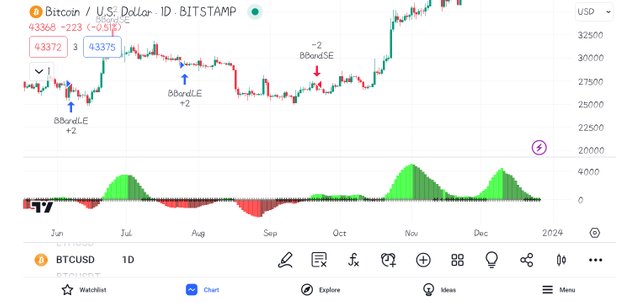
screenshot gotten from Tradingview app
As a trader using this indicator, you will be provided with information about the rise and fall of whatever cryptocurrencies that you want to analyze before entering or exiting the market. This is an indicator that tells traders about the time the market is flat and when the market is following a trend which you are going to be seeing practice examples.
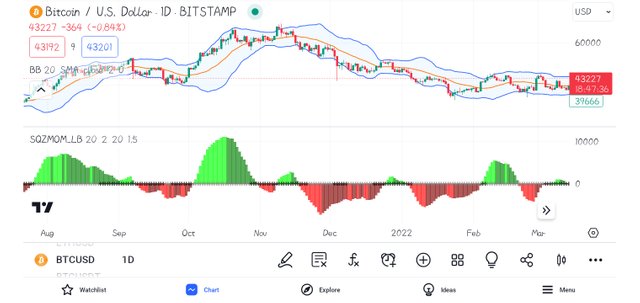
screenshot gotten from Tradingview app
Looking at the screenshot image above, you can see that two indicators which are the Keltner channel and Bollinger band are combined to form this Indicator to give you and other traders a clearer picture of how the market is moving concerning the change in price so you can make a better decisions for yourself. Let's take a good look at the quality of SMI
| The visualization of SMI |
|---|
From the indicator, you can colors such as black and Red dots. The black dots are the color that appears often anytime the Bollinger bands break outside the Keltner channel, and the dots will automatically turn grey, but it's not applied on the chart share because it is not a paid service.
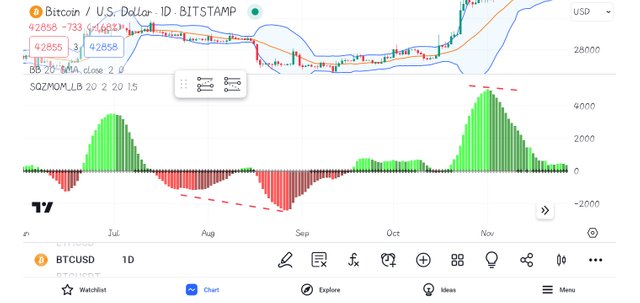
screenshot gotten from Tradingview app
The Green and Red Histogram; These are the two things that show you the movement of price. If you see that the bright green has changed from bright to dark green when the price of the asset has begun to decrease and the bright red also changed from bright to dark red when the price begins to increase you should know the price has either increased or decreased.
Example
Let's consider looking at the 1D chart of BTC/USDT below.
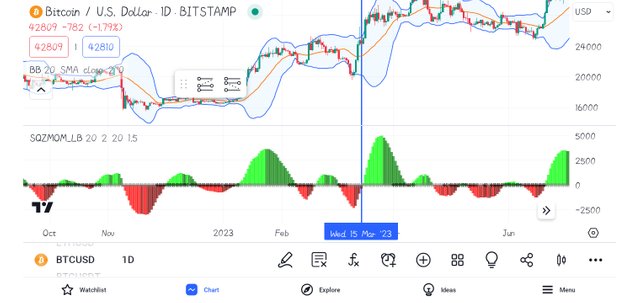
screenshot gotten from Tradingview app
From the chart, we have marked the breakout which occupies the same space as the bullish trend. The screenshot shows that the breakout shows that the SMI black dots are replaced by the grey ones and the green histogram begins to grow.
###Conclusion
We have learned what the squeeze momentum indicator is through the explanation and examples with have shared in this post. It is an indicator that shows you how prices change over time. Note: whatever you have or seen is solely for educational purposes, and nothing more.
Note:- ✅
Regards,
@theentertainer
Thank you, friend!


I'm @steem.history, who is steem witness.
Thank you for witnessvoting for me.
please click it!
(Go to https://steemit.com/~witnesses and type fbslo at the bottom of the page)
The weight is reduced because of the lack of Voting Power. If you vote for me as a witness, you can get my little vote.
https://x.com/AkwajiAfen/status/1739529579750904024?s=20