Learn how to Trade the Crypto Market Using Moving Average Envelopes
As a trader identifying change in trend is very important as it helps you to know the direction of the market you can use moving average envelopes to identify trend changes.
In many of our lessons we have learned about moving average, trendline, trend channels, and so on in moving average we talked about when the price of an asset close above the moving average is a signal for you to buy the underlying asset, whereas, a sell signal is when the price of an asset closes below the moving average vice versa.
However, we are here to discuss moving average envelopes.
| Moving Average Envelopes |
|---|
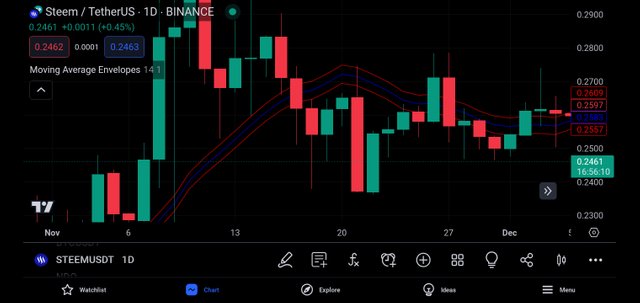
Moving Average Envelopes has two lines beside having moving average. Talking about the two other lines one of the lines is usually above the moving average while the other line is below the moving average which they both stand for lower envelope and upper envelope.

Tradingview App
Moving Average Envelopes helps you to Confirm Trend, and identify the level of overbought and oversold which gives you the easiest ways to enter the market.
Moving Average Envelopes can be used as a trend indicator which is why most expert traders prefer using MAE to confirm trends we have discussed how you also can use it to confirm trends.

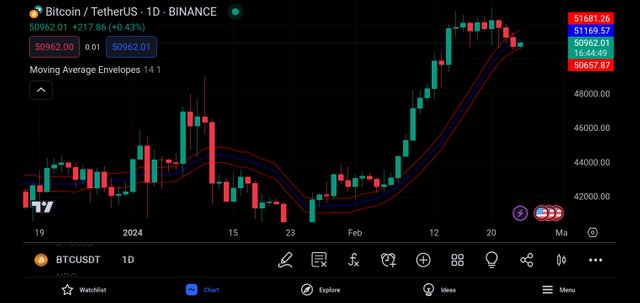
Tradingview App
The direction of the envelopes is determined by the moving average direction which you have to put an eyes on your chart and get the results below.
When you see that the envelopes are moving higher, you will see the price of the underlying asset in an Uptrend.
When you see that the envelopes are moving lower, you will see the price of the underlying asset in a downtrend.
Now in a situation where you see that the environment is moving in a sideway direction, you will see the price of the underlying asset is either moving uptrend or downtrend which is considered a directionless move and a neutral trend.
As a trader, your focus should be when the price of the underlying asset you are trading has moved below or above the envelopes.
To this, if you see the price of the underlying asset plunges above the upper envelope it means the market is bullish, but if it plunges below the lower envelope it means the market is bearish.
| Buy Signal |
|---|
Buy signal is when the price of the underlying asset you are analyzing has closed above the upper envelope.
| Sell Signal |
|---|
A sell signal is when the price of the underlying asset you are analyzing is close below the lower envelope.
For Example: STEEM/USDT

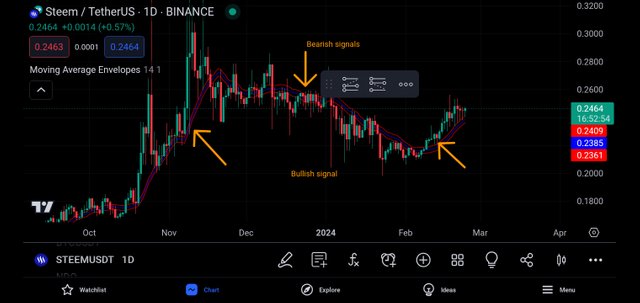
Tradingview App
From the chart, you can see how the 20-day SMA which is the orange color line, and the hopper and lower envelopes which are the blue color lines are moving higher.
Looking at the chart you can see how the price of STEEM/USDT managed to close above the MA. To this, if you want to confirm if the trend has changed from bullish to bearish, you will have to wait until the price of STEEM has closed below the lower envelope.
| Calculation |
|---|
Calculating moving average envelopes is very easy all you need to do is apply the following;
- You have to decide if you are ready to use exponential moving averages (EMA) or if it is a simple moving average (SMA) that you want to use.
Whatever moving average you have decided to use, you will need to select the number of times you wish to apply the moving average before you can set your envelope's percentage value.
For instance, using a 20-day moving average with a 1% envelope you would have the following lines as your results.
Upper Envelope = 20day SMA + (20 day SMA × 1%) 20 day SMA
Lower Envelope = 20 days SMA - (20 days SMA × 1%)
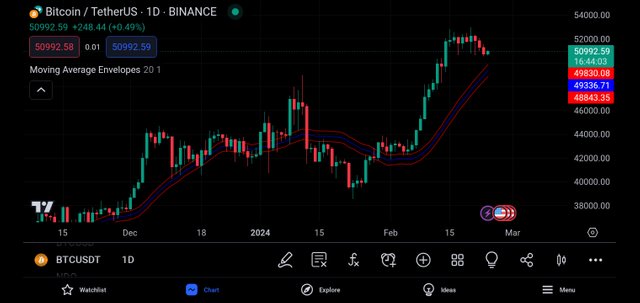
Looking at the below chart of BTC/USDT with a 20-day SMA and 1% envelopes you will see that the blue line envelope moves parallel with the 20-day SMA of the orange line.

Tradingview App
Conclusion
It is good to know how to identify trend changes which is what gives you a perfect direction of price which you can identify using moving average envelopes. Today, we have learned about upper and lower envelopes and other things here. Note: this post is for educational purposes only.
https://x.com/AkwajiAfen/status/1761289737699033314?s=20
Note:- ✅
Regards,
@theentertainer