Knowing What Cumulative Volume Index Indicator is.
Every potential investor and trader is interested in knowing the inflow and outflow of the capital of an asset, as an investor/trader that you are you can make use of the cumulative volume index indicator to know the net inflow flow of the asset you want to Invest in which in this post, you will know how to do that using the CVI Indicator which is the subject topic for today.
Cumulative Volume Index (CVI) Indicator
As we have introduced earlier CVI is an indicator that helps you to know the in and outflow of an asset in the market. This means the difference between the number of assets that are advancing the market and the number of assets that are declining in the market.
Tradingview
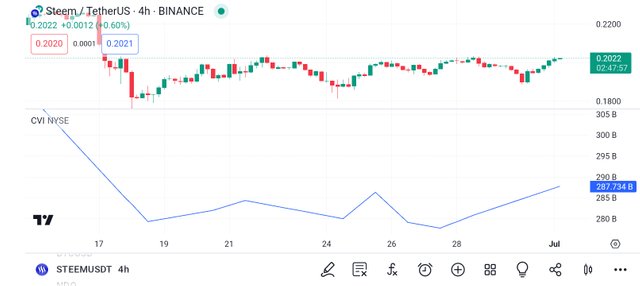
Looking at the above screenshot you will see that the CVI Indicator is showing us the direction of a market index, of Steem/USDT at the time which the market was analyzed. Also, by looking at the CVI closely you will see that it looks more like the on-balance volume indicator, which it isn't because it focuses on the number of assets instead of looking at volume which you can also see the area where the index is advancing or declining.
Interpretation (Readings)
It is very easy for you to interpret the CVI Indicator which all you have to look at for is how the movement is related to the price of the asset so you can identify whatever signal you want to identify.
Tradingview
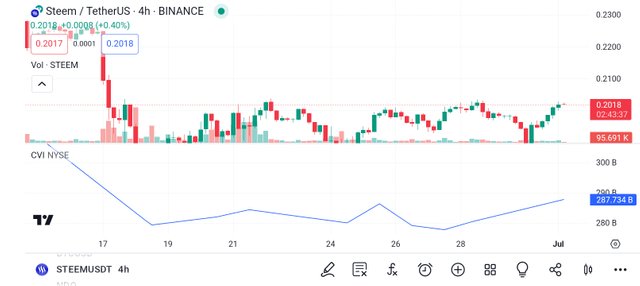
Having said so, when you see that the CVI is rising, showing you that the CVI is advancing higher, it means the market strength is gaining, whereas when you see that the CVI is declining it means the market is becoming weak, which the CVI couldn't hold but declined. As a trader, you can look for convergence or divergences between the CVI trend lines and the price of the asset you are analyzing.
Calculations of CVI
Every indicator has its way it is calculating which as for CVI the given formula below is the formula you can use when calculating CVI.
CVI = Prior Period CVI + (Advancing assets - Declining assets)
Where:
Advancing assets - The number of advancing assets in the current period
Declining assets - The number of declining assets in the current period
Tradingview
The best way you can get clear results when using the CVI Indicator is for you to combine it with other indicators such as the volume Indicator as CVI can do well when it comes to breadth measurements.
Example
Tradingview
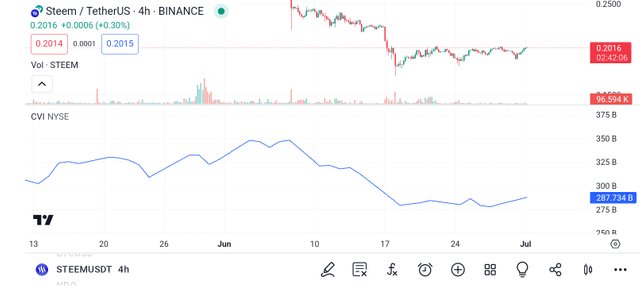
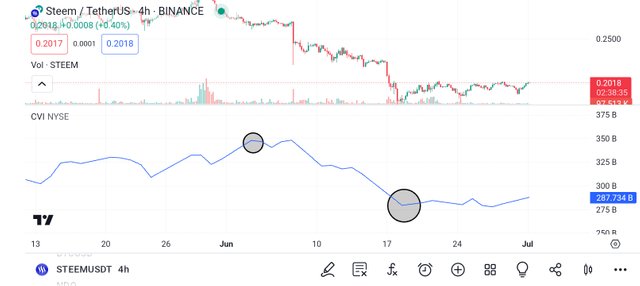
Looking at the above chart, of the cumulative volume index that is applied to STEEM/USDT pair beginning from June down to the current date at the time of writing this post.
Based on the given information as shown in the chart, the cumulative volume index indicator is the blue line that began increasing at the beginning of June and started decreasing in the middle of June but then tried to increase again towards the of June.
Disclaimer
The cumulative volume index indicator is what we have learned from this post, which is an indicator that helps you to know the inflow and outflow of whatever asset you want to know about for you to be able to know the market direction you have to combine the CVI with other on-balance volume indicators. Note that this post is purely written for education and not investment advice.
Thank you, friend!


I'm @steem.history, who is steem witness.
Thank you for witnessvoting for me.
please click it!
(Go to https://steemit.com/~witnesses and type fbslo at the bottom of the page)
The weight is reduced because of the lack of Voting Power. If you vote for me as a witness, you can get my little vote.
Note:- @josepha, twitter link is missing
Regards,
@theentertainer
I have now shared the Twitter link.
https://x.com/AkwajiAfen/status/1808066348922106131