How You Can Use Williams Percent Range Indicator For Your Analysis
"Williams Percent Range" is an oscillator indicator created by this good man named Larry to inform you about the time the price of the cryptocurrency or any asset that you want to analyze will become overbought which is overpriced or oversold which is underpriced in the market.
screenshot gotten from Tradingview app
Williams Percent Range is best described as Williams %R which in some trading platforms you may see the percentage written as %R. It is an Oscillator momentum indicator that helps traders to know where the last closing price of an underlying cryptocurrency (asset) is relative to the highest price and lowest price of the underlying cryptocurrency price at a given period.
Using this Indicator, you will be able to know when the cryptocurrency like for example STEEM/USDT pair might become overbought or oversold in the market.
It is not a popular Indicator because there are several indicators that the Williams %R indicator works similarly which is why some are called Stochastic lower versions and a brother to the RSI Indicator since it provides you with signals the same way RSI provides.
The main difference between the Williams indicator and RSI is that Williams %R makes use of negative levels such as -20 and -80 as it signals whereas RSI uses 50 levels above as a bullish trend.
Tradingview is the most popular website/app for analyzing the crypto market, forex market, and other financial markets that deal with assets which is why I like using it for conducting technical analysis I will recommend you have a Tradingview account for yourself.
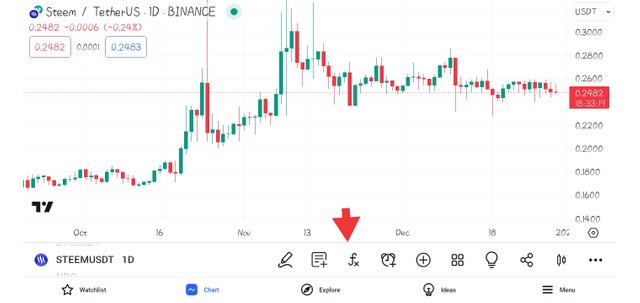
Okay, let's agree, you have the Tradingview app and you want to launch the Williams Percent Range Indicator. All you have to do from the App after you have selected your crypto pair, in the chart is to click on the sign indicated in the screenshot.
 |  |
|---|
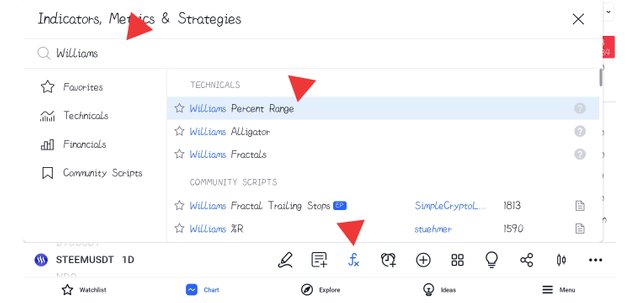
Click on Indicator head to the search box type in Williams Percent Range tap on the name once and exit you will see the Williams Percent Range Indicator on your chart as shown in the screenshot.
 screenshot gotten from Tradingview app
Want thing I would like to let you know about Williams%R is that it uses the same formula as Stochastic to pinpoint the direction of the asset you want to analyze the only little difference with Stochastic is that it makes use of lower price to show you the direction of the asset, whereas Williams % make use of higher price to show you the closing position of an asset.
When it comes to scaling stochastic is a scale from zero (0) to hundred (0) while Williams %R is a scale from zero (0) to minus (-) hundred (100).
- A stochastic scale of 0 to 100
- Williams %R 0 to - 100
Now in Williams %R when the line is above -20 it means the market is overbought, but when it is below -80 it means the market is oversold.
When it is overbought it means the price of the asset is closer to the high of its current range, whereas for oversold it is closer to the low recent range.
| How to determine a trend using Williams %R |
|---|
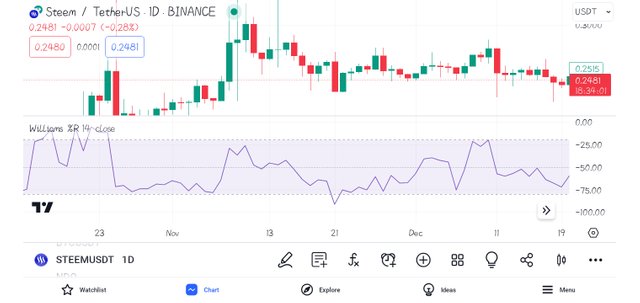
Now here we find out if the Williams Percent Range Indicator has helped us to know if the price of the STEEM/UDST pair is following a bullish or bearish trend or not.
screenshot gotten from Tradingview app
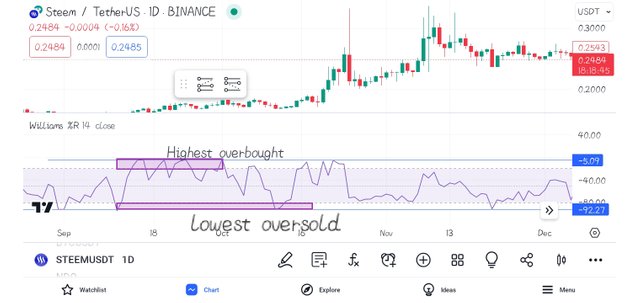
From the above, you can see it is a STEEM/USDT pair and we have applied the Williams %R in the chart which is on the left side where the indicator line is a number from 0 to - 100.
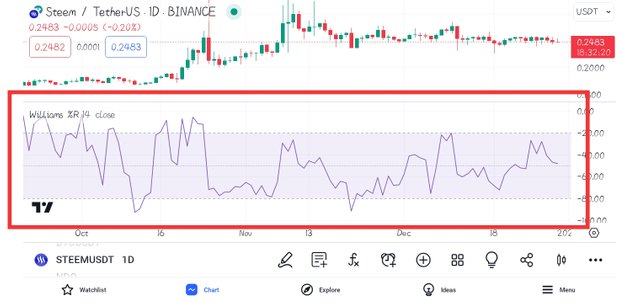
Looking at the below chart you will see that the price of STEEM/USDT tried to move upwards at different times, but still failed to hit a new price and the Williams %R.
 screenshot gotten from Tradingview app
In the Williams %R the price of rise from the lowest oversold -92.72 to the highest overbought -5.09 and created the level of support and resistance to move higher again which still failed to reach a new price.
Conclusion
Today, we have learned what the Williams %R indicator is, and how it can be applied to a chart using a clear example from Tradingview. This post is highly published to serve as an educational document and not investment advice.
Thank you, friend!


I'm @steem.history, who is steem witness.
Thank you for witnessvoting for me.
please click it!
(Go to https://steemit.com/~witnesses and type fbslo at the bottom of the page)
The weight is reduced because of the lack of Voting Power. If you vote for me as a witness, you can get my little vote.
https://x.com/AkwajiAfen/status/1740987754161570219?s=20
Note:- ✅
Regards,
@theentertainer