How you can Draw Demand Zone and Supply Zone For the Perfect Trading Decision
Friends, here are here again to continue our decision on our previous post which you can read from here in case you missed reading it.
In our previous decision, we discussed demand zones and supply zones without going dipper since it was just an introduction today we are here to learn how we can draw draw, trade, and find the demand Zone and supply zones so we can make a good trading decision.
| Drawing Demand Zone and Supply Zone |
|---|
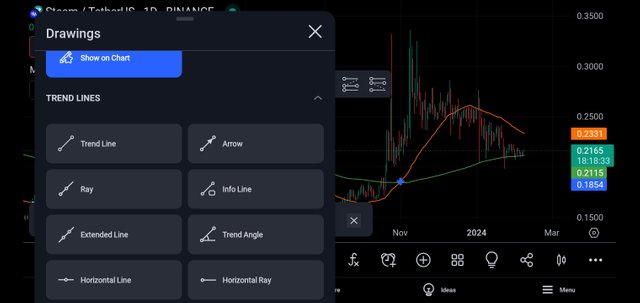
On a chart, if you want to get any levels perfectly, you can get it by the use of the "Trend Line" tool.
Now in this case you will have to open a chart such as STEEM/USDT, TRX/USDT, ETH/USDT, BTC/USDT, BNB/USDT, etc, and select the tool on the left-hand side if you are using the Tradingview web version or opening via your personal computer, but if you're opening it via the use of Tradingview app via your smartphone you will see it below.

Tradingview app
At this point, you have to select the "Trend Line" tool and draw your lines by lift-licking on any point in the chart which will serve as your starting point.
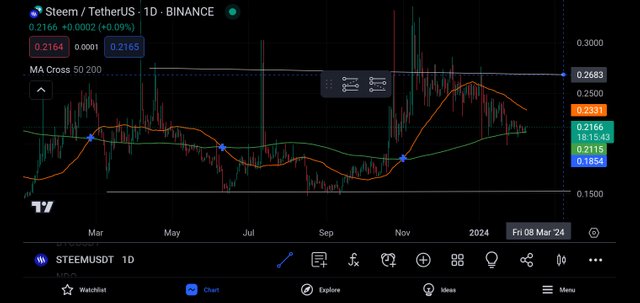
At this point again you have to left-click or draw the line to the direction of support or resistance levels to create an endpoint.
Ensure you draw the supply zone based on historic peak levels in the chart.

Tradingview app
- Create another line to complete a demand area or support area. In this case, you have to draw the lines based on the bottom where the asset bounced back up or fell.
| Finding the Demand Zone and Supply Zone |
|---|
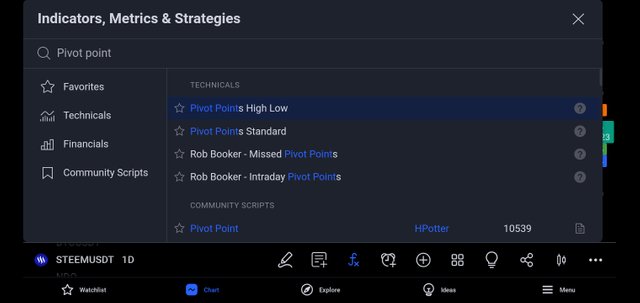
For you to be able to find/identify the demand Zone and Supply Zone you have to use like "pivot points" indicator that helps traders to identify key areas (levels).
- To add a pivot, you will have to click on Indicators at the top if you're using a web version, or at the bottom for an app version search for "Pivot Points" and then select it.

Tradingview app
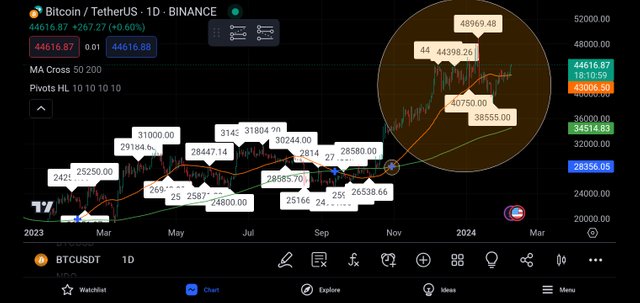
- Selecting the pivot point indicator will help you highlight the areas of resistance and support which will help you and Mark them with S as support areas and R as resistance areas.

Tradingview app
- From the chart, you can see at the time BTC reaches the resistance level of $48,969 (R1) the price begins to drop down, and at the time it reaches its lower low of $38,550 the price begins to bounce up.
| How to trade on Demand zones and supply zones |
|---|
Trading demand Zone and supply zones is very easy as all you first need to do is to identify the key levels of support and resistance which can be best identified on the 1 D time frame and above.
The demand zone is the area you can buy, whereas the support zone is the area you can sell for profits.

Tradingview app
For instance, if at the time you start analyzing the market, BTC is trading at $44,000 and the demand Zone is between $38,550 - $40,750, you can place a buy order and sell when it reaches back to $44,000 which is the supply zone.
Conclusion
Today in this post, we have learned about drawing, identifying, and trading demand zones and Supply zones which are important for making better decisions in the market. Note, that this post is purely written as educational material and nothing more.
Thank you, friend!


I'm @steem.history, who is steem witness.
Thank you for witnessvoting for me.
please click it!
(Go to https://steemit.com/~witnesses and type fbslo at the bottom of the page)
The weight is reduced because of the lack of Voting Power. If you vote for me as a witness, you can get my little vote.
https://x.com/AkwajiAfen/status/1755471320333136166?s=20
Note:- ✅
Regards,
@theentertainer