Correlation Coefficient Indicator: What You Should Know
Tradingview
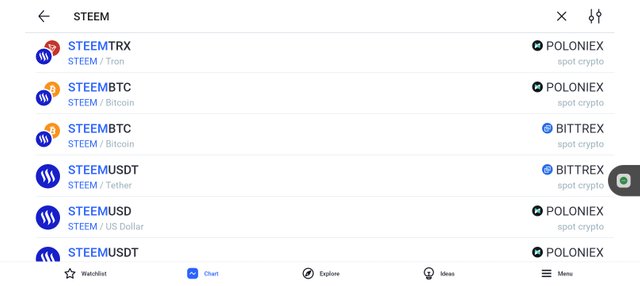
Generally, in the financial markets, two different assets are paired together in the crypto market, it is usually a cryptocurrency and stablecoin (STEEM/USDT, STEEM/USD, STEEM/BTC ) as seen in the screenshot image.
Tradingview
The relationship by which two different assets move together is known correlation coefficient which is what we will be discussing in this post today.
| Correlation Coefficient Indicator |
|---|
In school, we were been taught that the correlation coefficient is the measurement between different variables as we have seen in the screenshot we have shared at the beginning of this post. However, in terms of crypto trading, correlation coefficient is seen as the degree to which two assets for example; Steem/USDT or STEEM/BTC are moving about each other.
Tradingview
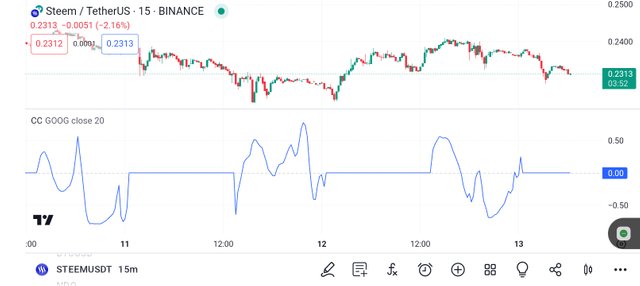
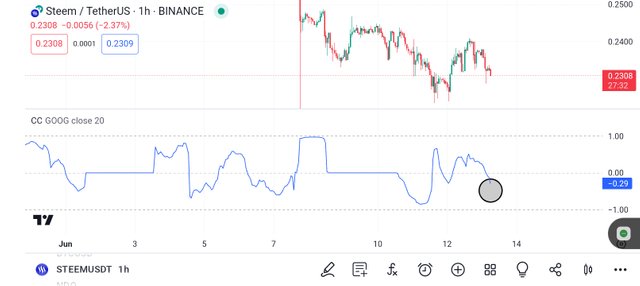
Taking a look at the above chart of the STEEM/USDT pair, you will see how both assets are assets with each other. This means the correlation coefficient indicator is an indicator that helps traders, financial analysts, Investors, and so on to evaluate the strength of the relationship between the prices of different currencies (asset). The degree to which two asset pairs are related together is correlation means.
The correlation coefficient indicator helps you to understand the difference between two different currencies from the example we have given so far, by understanding the difference between the currency pair you are trading or analyzing you will be able to make an informed decision while buying or selling.
| How to Read Correlation Coefficient Indicator |
|---|
It is very easy to understand the correlation coefficient indicator as it is an indicator that lets you know the difference between how two assets are related to each other by showing you the positive and negative value of the asset's direction.
Tradingview
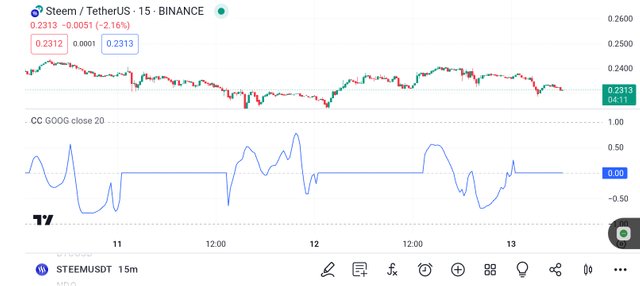
When you see that the indicator is moving in the positive direction, it means the two currencies (assets) are moving in the same direction and the value will be seen at +1 meaning both currency pairs are moving up and down at the same time. This is for positive value (+1), let's look at the negative values.
Tradingview
As for the negative value, you will see both assets (currency) moving in opposite directions the value will be seen at -1 meaning as one of the assets has risen, the other asset has fallen, by an equivalent amount or amount higher than that which falls. A value from 0 to - 1 is a negative value which you know.
Tradingview
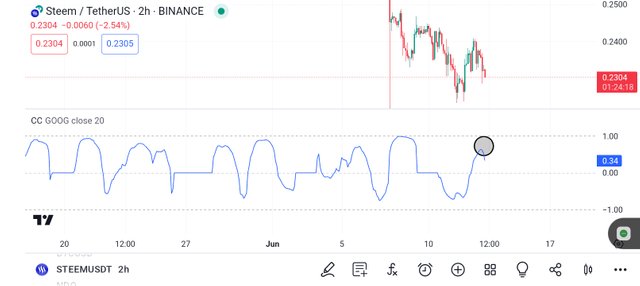
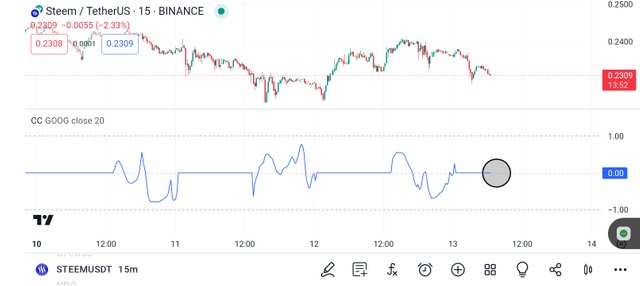
If you see a 0 coefficient, just know there is no correlation, which means the movement of the currency pairs is independent of each other. In summary, both currencies have no relationship at the moment.
Disclaimer
We have just talked about the correlation coefficient indicator as an indicator that is used to measure the relationship between a different asset that is related to each other, which you have to treat this post, as educational content and not investment advice.
https://x.com/AkwajiAfen/status/1801142759228592133