An Introduction to Zig Zag Indicator
When it comes to knowing the key price movements zig-zag Indicator is what most traders use to measure key price movements. It is an old indicator that allows crypto traders, forex traders, stock traders, and everyone who trades the financial markets to visualize the structure of the financial markets. The zig-zag Indicator is our topic of discussion today.
| Zigzag indicator |
|---|
Tradingview App
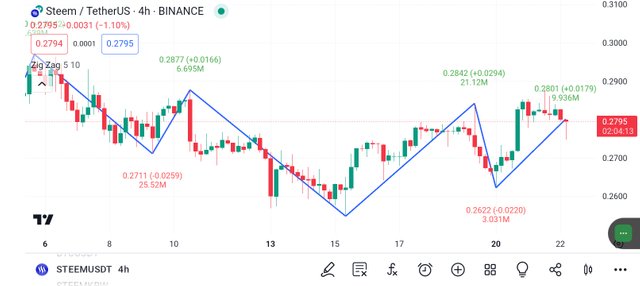
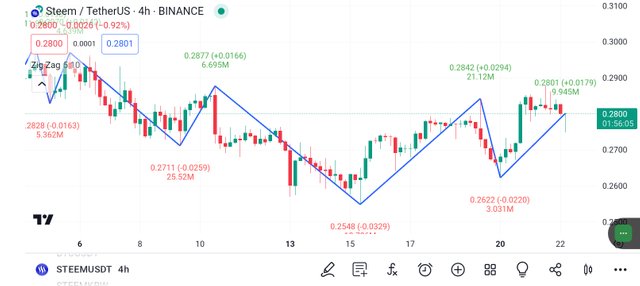
The zigzag indicator has been applied on the chart above chart, and looking at the chart you will see that the Zigzag has helped us to measure (identify) the key price movements of STEEM/USDT without making noise.
Based on what we have seen on the chart, it is now clear to us that zigzag is a lagging indicator that helps us identify the key points on a price chart by connecting lines. It is an indicator that automatically helps traders remove small price movements, which in the screenshot you will see that small price movements aren't identified.
The zigzag indicator, works perfectly by identifying the distance between price swings of lows and highs swings, and using it you will get to see a clearer picture of the market structure of the underlying asset.
| How Zigzag Works |
|---|
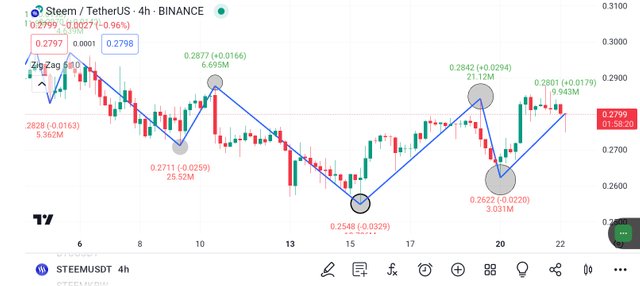
Filtering out noise, and wrong price movements, and identifying the key swings highs, and lows trend is the purpose why the zigzag indicator was developed. It helps you to identify the most important point which is the highs and lows points of the price of the asset you are analyzing by connecting lines and ignoring small price movements.
Tradingview App
From the above chart, you will see that the Zigzag indicator has helped us to identify the key price movements of STEEM/USDT we have seen a clearer picture of the market as we can identify the head and shoulders pattern of the chart which we can use our potential sell or buy signal.
Also, Zigzag helps us to see the past price movements of the market and not forecast future prices. At the time the price of STEEM/USDT moves higher or lower zigzag indicator has shown us a clearer picture of how the market has moved in the past.
| How To Apply Zigzag Indicator on a Chart |
|---|
Tradingview App
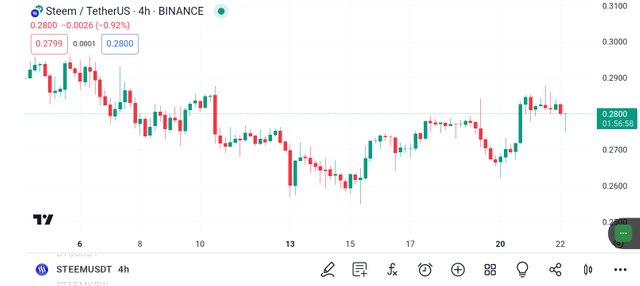
If you want to add Zigzag to your chart, your first step should be opening a chart and selecting your currency pairs. Once you have opened a chart and selected the currency pair, then click on the indicator symbol (icon).
Tradingview App
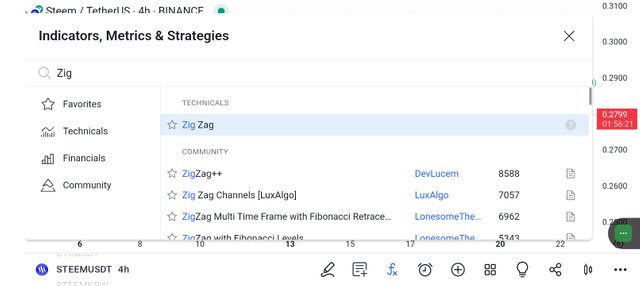
Once you have clicked on the symbol you will be taken to a new page view, where you can search and apply the indicator. Search for the zigzag indicator and select. Once you have selected to back to your chart you will see that the indicator has been fully added to your chart.
Conclusion
Today, we have so far discussed about zigzag indicator which is used for measuring significant price movements and eliminating small noise. Note: this post is not financial or investment advice, but educational content that is written to educate you about the zigzag indicator.
Thank you, friend!


I'm @steem.history, who is steem witness.
Thank you for witnessvoting for me.
please click it!
(Go to https://steemit.com/~witnesses and type fbslo at the bottom of the page)
The weight is reduced because of the lack of Voting Power. If you vote for me as a witness, you can get my little vote.
https://x.com/AkwajiAfen/status/1793161878681842172
Note:- ✅
Regards,
@jueco