An Introduction to Woodie CCI Indicator
There are many strategies to trade the financial markets such as the crypto market which is now becoming so popular that you can either choose to develop a strategy of your own or follow the strategy which has already been developed by experts in the financial markets. The Woodies CCI indicator which we will be looking out is one of the strategy indicators that helps you to look at graphics and another key trading point.
| Woodies CCI indicator |
|---|
Before we begin Wood Ken is the developer who created the Woodies CCI indicator to help traders search for graphics as the graph is a representation of how data is moving.
Tradingview
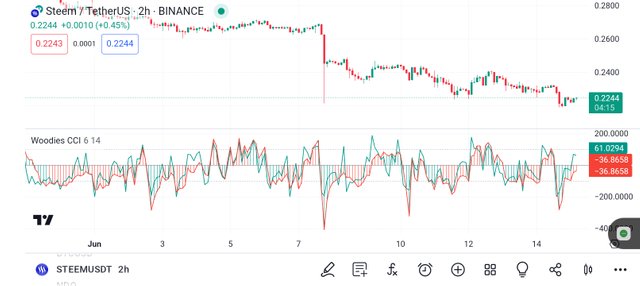
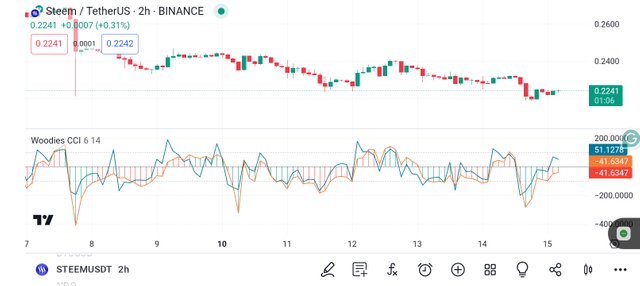
By looking at the above chart you will see that the Woodies CCI indicator has a graphic display, which analyzes the movement of the price of the traded asset in the chart to help us define clearly the trend of the asset through the use of histogram. Also, it has a green and red bar, which if you see that the bars are below the red and zero, means the market is descending, whereas if it is above the green and zero, it means the market is ascending.
Tradingview
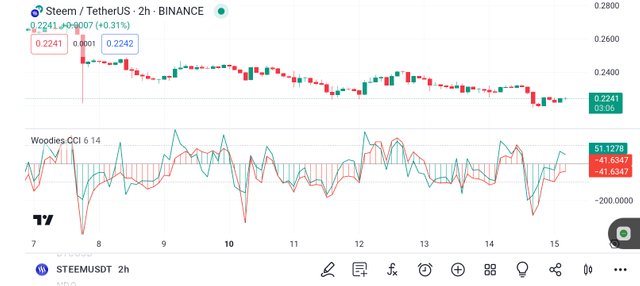
Two charts are what made up the Woodies CCI indicator as we have seen from the screenshot above. These two charts are known as the CCI Turbo which helps you to identify entry and exit points in the market and the CCI chart*, which helps you to know the direction of the market.
| How to Add Woodies CCI indicator |
|---|
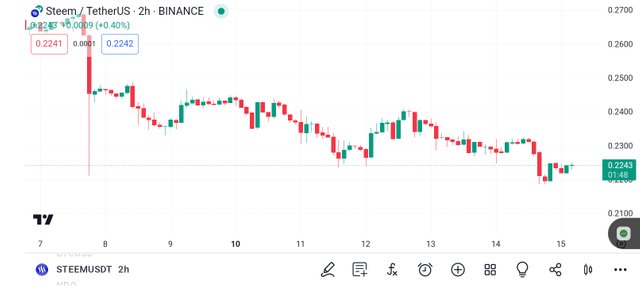
It is easier to add on Tradingview all you need is to have an account with Tradingview, and then select a currency pair under the chart.
Tradingview
Once you have selected the asset you want to analyze, you will see an indicator symbol at the top, if you are using the web, but if it is the app you are using you will see it down below as shared in the screenshot.
Tradingview
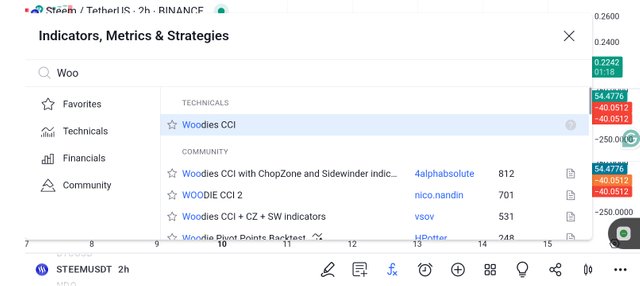
At the search bar, type in Woodies CCI and select the indicator with one tap, then exit back to your chart, you will see the indicator inserted into your chart.
| Reading of Signals and Trends. |
|---|
Tradingview
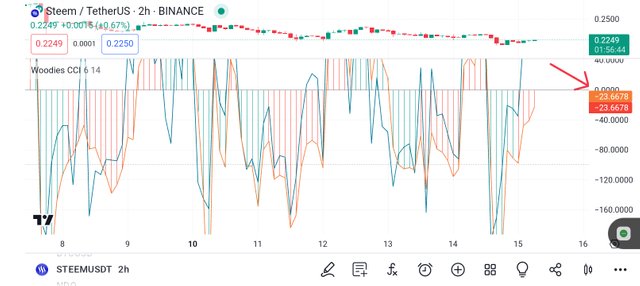
As we have talked about earlier, a cross above the zero line, means an uptrend market, whereas a cross below the zero line, means a downtrend market besides looking at the signals you can keep looking at the other signals we have discussed below.
CCI Divergence:
Divergence happens when the price of the asset starts a new high or a new low, and the CCI fails to correspond with the new high or low form by the price of the asset. Seeing this means there's likely a reverse in the market.
Zero Line Reject:
This happens when the CCI comes close, but can't cross the zero line, and then moves in an opposite direction. It can be a rejection of bullish or bearish zero, in a bullish market, the CCI will be above the zero line, and wouldn't cross below, which will begin to move back, whereas in a bearish zero, the CCI does cross below the zero line and roses closer to it, but cannot cross above before it will begin to move down again.
Chop Zone:
This zone is plotted in two ranges which are plus + 100 and minus -100 and displays the difference between its EMA and the closing price of the asset which comes in many colors.
Disclaimer
We have finished with the discussion of the Woodies CCI indicator for today, which can be a potential graphic indicator for spotting entry and exit prices in the market. Note that this post is strictly prohibited as investment advice but serves as educational content to help you advance your knowledge in trading the financial markets.
https://x.com/AkwajiAfen/status/1801858875794096545
Note:- ✅
Regards,
@theentertainer