An Introduction to Spinning Top Candlestick Chart
This is a candlestick that is similar to the doji candle which is so easy to identify. It is the candlestick that makes indecision in the market which you will see it having a long upper shadow and lower shadow and a body in the middle of the upper and lower shadow. Let's learn more about this candlestick.
| Spinning Top Candlestick |
|---|
It is a chart pattern just like every other candlestick, which is what makes the spinning top candlestick different from others in how a single session is formed.
As we have earlier introduced the spinning top candlestick, is a candlestick that has a short body with a long upper shadow and lower shadow on either side of the body, which implies how the market rises higher and falls lower over the session, and ended up next to where it begins.
Also, remember that at the beginning of this post, we mentioned of doji candlestick which is very similar to the spinning top candlestick. However, what makes both different is the short body that the spinning top candlestick has, whereas, in a doji candlestick, you will see a long-legged one with nobody.
| What does spinning top candlestick mean |
|---|
It is a candlestick that tells you how far the market has reached an indecision point. Within the market period, bears sent the spinning top down, whereas bulls sent the price up higher, but couldn't maintain the momentum at the end of the session.
Based on the color of the candlestick you can tell if the market is bullish or bearish in the financial markets, a bullish market is categorized by a green candle color whereas a bearish market is categorized by a red candlestick.
| Example of Spinning Top Candlestick |
|---|
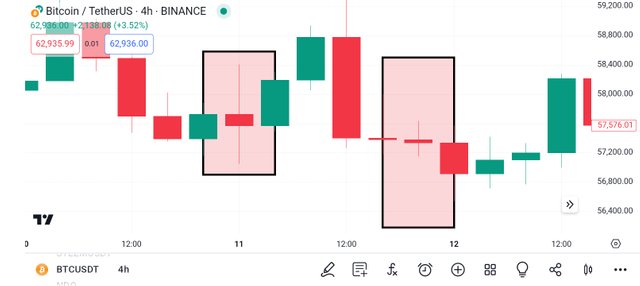
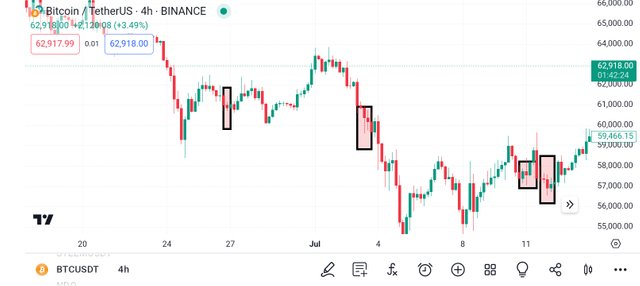
The below screenshot is a chart of BTC/USDT with a spinning top that has been identified in the chart as indicated with a rectangle.
From the chart, you will see that the first spinning top candlestick came out after a consolidation period following an uptrend to $62,917 and marks the beginning of a new decline in the market that pulled the price down to $60,785. This is just for the first two spinning top candlesticks indicated on the chart.
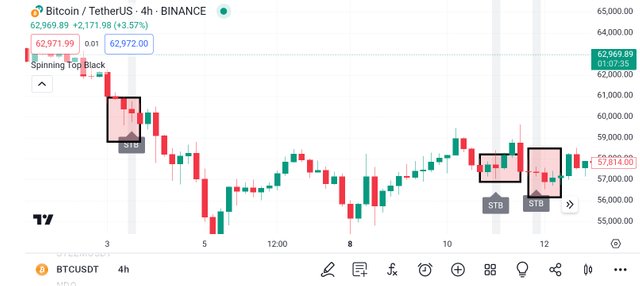
Let's see if we can use the spinning top back Indicator can identify the spot of the spinning top candlestick we have indicated in the chart.
Having said so, we have applied the spinning top Black indicator which has helped us to point out the candlestick that is spinning top among the ones we circle with a rectangle rectangle
Disclaimer
We have discussed the spinning top candlestick which is formed as a single candlestick with a short body and a long shadow at both sides of the short body. Please note that this post is not investment advice, but serves as educational content.


Thank you, friend!


I'm @steem.history, who is steem witness.
Thank you for witnessvoting for me.
please click it!
(Go to https://steemit.com/~witnesses and type fbslo at the bottom of the page)
The weight is reduced because of the lack of Voting Power. If you vote for me as a witness, you can get my little vote.
https://x.com/AkwajiAfen/status/1812743437755597170
Note:- ✅
Regards,
@jueco