An Introduction to Multi-period Chart Indicator
Trading the financial markets practically hasn't always been easy, as what you are been told by experts through watching videos or reading, is putting the knowledge of what you have learned into practice that has been the problem.
This is why it is advisable for you to always analyze the market yourself so you can know or develop the best trading strategy for yourself as relying on someone's strategy can be difficult. Here I will want you to pay attention to our lesson of today which is about "multi-period chart indicator"
Multi-Time Period Chart Indicator

Tradingview
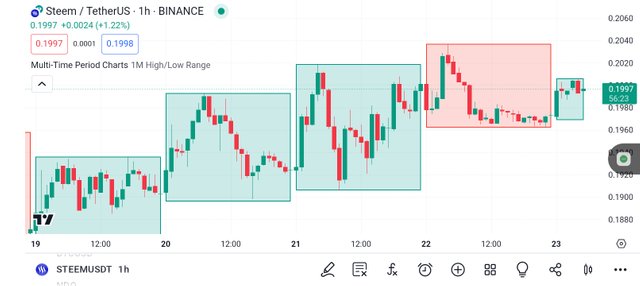
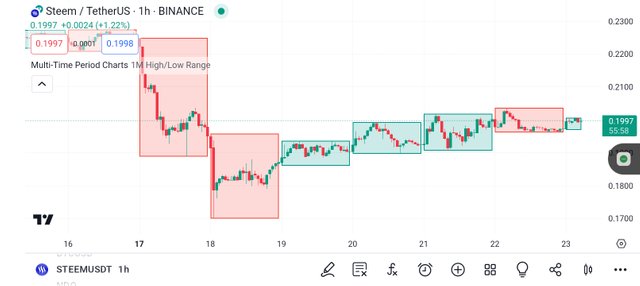
Looking at the above chart, you will how the green and red boxes in which the candlesticks are inside represent the movement of the price of the asset on a separate timeframe. The green color covers the places with the highest bull candlesticks, whereas the red covers the places with the bear candlesticks are many.
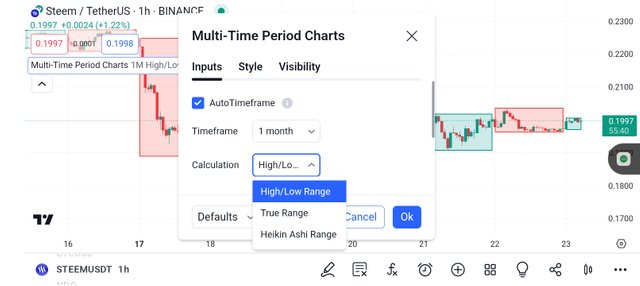
The purpose of the multi-period chart indicator is to allow you to compare price movements (action) visually across different timeframe which offer you more flexibility to select between automatic mode which is based on predefined rules or you can manually configure the indicator according to how you want it which is known as custom settings.
Keynotes
Now as a crypto or forex trader you can use this indicator and analyze the STEEM/USDT price action across different timeframes and have a comprehensive view of the market at a glance.

Tradingview
It is a user-defined indicator that you can configure or make use of the already predefined settings that have automatically been set. Finally, it is a visual indicator that represents the price movements beginning from high movement to low movement within a certain timeframe.
As new data such as price change becomes available the indicator will automatically update the boxes that have been seen on the screenshot wirprof the update is to ensure that it remains correct according to the following conditions.
The multi-period chart provides you with a tool that you can use and conduct multi-stream analysis aiding in recognizing patterns identifying trends and making good trading decisions that would help you make profits.
Calculation
When calculating the multi-time period chart indicator, you have to first calculate the true range period of the prior period of the high/low range for the period you have chosen.

Tradingview
After calculating that, the next is for you to calculate the heikin Ashi high and low period for the period you have chosen
Disclaimer
We have learned what a multi-time period chart indicator is in this post, which this post is only written as educational content and not as investment advice.
Thank you, friend!


I'm @steem.history, who is steem witness.
Thank you for witnessvoting for me.
please click it!
(Go to https://steemit.com/~witnesses and type fbslo at the bottom of the page)
The weight is reduced because of the lack of Voting Power. If you vote for me as a witness, you can get my little vote.
https://x.com/AkwajiAfen/status/1804743596886708247
Congratulations, you have enabled UVF by @boylikegirl.club
Common UVF commands:
1.uvf_info
Reply any post use "!uvf_info"
Display your UVF information
Note:- ✅
Regards,
@jueco