An Introduction to Moon Phases Indicator
In the financial, there are a lot of tools you can use to analyze the market which moon phase indicator is an indicator you can also use and analyze the market trend. As it is called moon phases it has phases like the moon which is why it is named moon phases more about the indicators have been discussed below.
| Moon Phases Indicator |
|---|
Moon phases is an indicator that displays the graphical representation of the moon on a chart which you can see on the screenshot of the chart shown below.
 Tradingview App
In a moon phase, there are three different quarters first, second, and third quarter. A new moon is indicated with a dark circle, whereas a full moon is indicated with a bright circle. A waxing warning is the bar between the full moon and the new moon.
Moon phases indicator goes through eight different phases with each of the phases lasting for up to 3 and a half days. The eight phases of the moon indicator are:
- New moon
- First quarter
- Waxing crescent
- Full moon
- Waning crescent
- Waning gibbous
- Waxing Gibbous,
- Third quarter
The eight aforementioned phases of the moon are what traders use as a signal for potential market moves of an underlying asset.
| The Theory of Moon Phases |
|---|
 Tradingview App
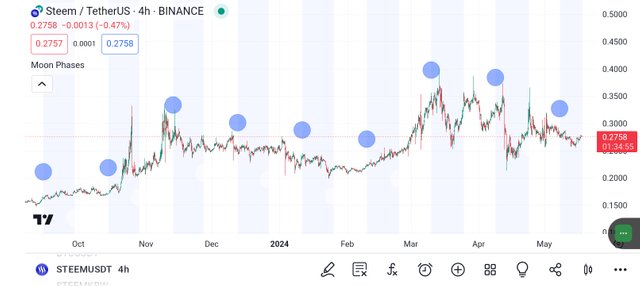
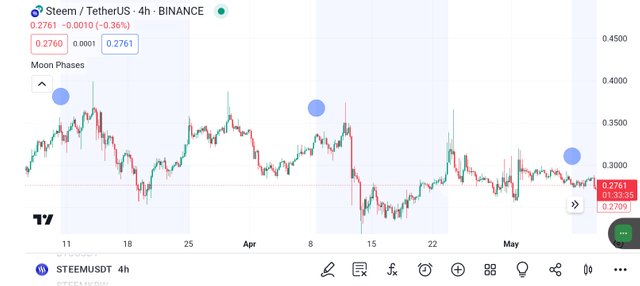
Here will be using the price chart for STEEM/UDDT to illustrate the accuracy of using the moon phase theory.
The black stands for Full Moon
The white stands for New Moon
The bars between the new and balloons are colored accordingly as waning or growing. To this one you see a full moon know that there is a local bottom for the price of STEEM/USDT. Seeing that you should also know that the price will fade slowly around 15 to 16 days before the moon will round and form a new moon at the top of the price.
 Tradingview App
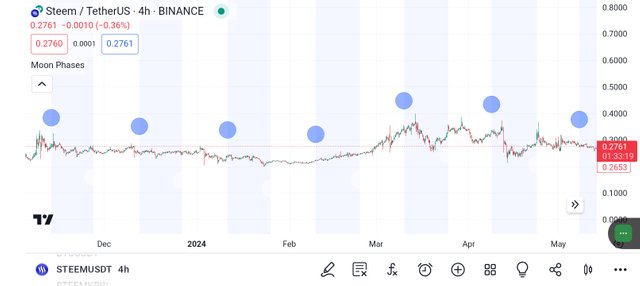
Point to note, the moon phase only tells you about the local top or local bottom for the price of the underlying asset you are analyzing. However, the advantage of using the moon phase is that it will help you to know if you are to go long or short in the market to make profits.
Conclusion
Today, we have so far learned what a moon phases Indicator is, which is an indicator for identifying local top and bottom top. Note: this post is not financial or investment advice, but educational content that is written to educate you about the moon phases.
Thank you, friend!


I'm @steem.history, who is steem witness.
Thank you for witnessvoting for me.
please click it!
(Go to https://steemit.com/~witnesses and type fbslo at the bottom of the page)
The weight is reduced because of the lack of Voting Power. If you vote for me as a witness, you can get my little vote.
https://x.com/AkwajiAfen/status/1791718098262770121
Hi, @josepha,
Thank you for your contribution to the Steem ecosystem.
Your post was picked for curation by @strawberrry.
- Explore Steem using our Steem Blockchain Explorer
- Easily create accounts on Steem using JoinSteem
- Delegate to @ecosynthesizer and wtiness vote @symbionts to support us.
Note:- ✅
Regards,
@theentertainer