An Introduction to Least Squares Moving Average
There are thousands of indicators for analyzing the financial markets which least squares moving average is among the best indicators for identifying trading opportunities in this post more about the indicator has been discussed.
| The Least Squares Moving Average |
|---|
LSMA is a short abbreviation that is used to identify "Least Squares Moving Average indicator. It is an indicator that is used to identify potential trading opportunities in the financial markets.
Tradingview App
The least squares moving average is like a variation of the moving average but traditionally the purpose of LSMA is to provide you with an accurate result when it comes to identifications or trends.
The LSMA also calculates the least squares regression line for the prior period down to the projection of the current period, which most traders see the indicator as an indicator that can identify potential trading opportunities if the regression line continues moving.
| How to read the least squares moving average |
|---|
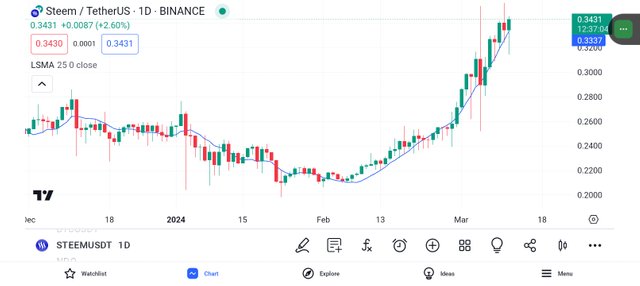
LSMA is mainly used as a crossover signal indicator to identify bearish or bullish trends in the market. Look at the chart shared below 👇 you can see that we have selected STEEM/USDT pairs and have applied LSMA which is the blue line.
Tradingview App
Our settings are default which is the 20 periods. A Signal is generated when the price of STEEM/USDT deviates from the indicator. Now Observing the chart we can assess the LSMA is making a change in trend.
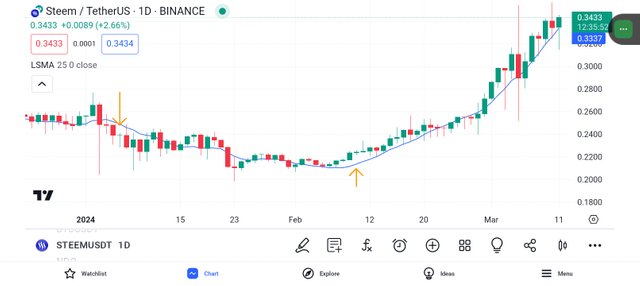
In a situation where you see that the signal changes to an uptrend along with a recovery in the price of STEEM/USDT, you should know that it is a buy signal. On the other way round, if you see that the signal changes to a downtrend along with a fall in the price of STEEM/USDT, you should know that it is a sell signal.
Tradingview App
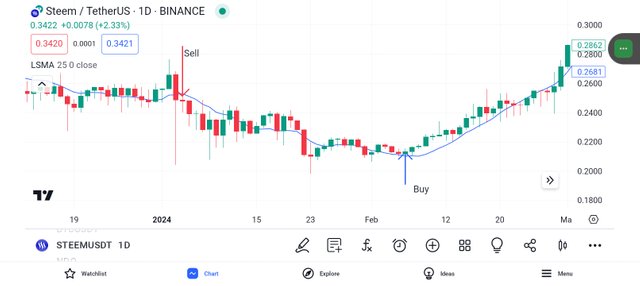
Looking at the chart, you can see clearly how buy signals and sell signals have been indicated which is indicated in color signifies a buy signal, whereas the red colour signifies a sell signal.
| Calculation |
|---|
Finding a straight line is what this Indicator emphasizes which for you to calculate it is based on the sum of least squares. However, the below formula is what is used for calculating LSMA
a = ( Σy – bΣx ) / n
b = ( nΣxy – ΣxΣy ) / ( nΣx² – (Σx)² )
Where:
- N = the number of data points selected
- Y = the price of an asset; x data. I.e it is equal to zero
- B = the slope of the line
| Combining LSMA with EMA |
|---|
The best way to use LSMA is to combine it with other indicators like the ones we will be looking at. At this point let's compare LSMA with RSI and EMA indicators and see if the signal we will get will be real or false signal.
Tradingview App
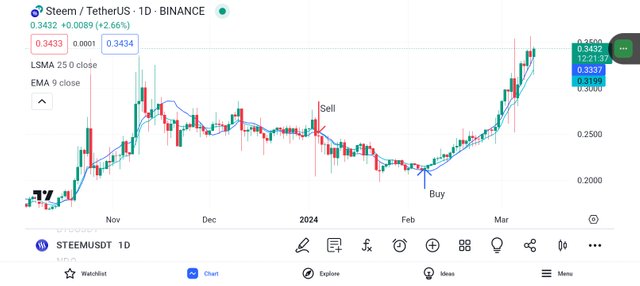
Looking at the chart of STEEM/USDT we have added EMA. From the chart we can see how the exponential moving average and LSMA indicator are moving hand in hand with the exponential moving average with the support of the relative strength index moving along both indicators.
Disclaimer
Whatever is discussed here is solely for education purposes related to crypto trading and nothing else. This post is not for financial advice or in any way related to financial support.
https://x.com/AkwajiAfen/status/1767156071536197816?s=20
Note:- ✅
Regards,
@jueco
Introduction to Least Squares Moving Average
good contribution and analysis my great friend