An Introduction to Historical Volatility Indicator
Hey friend just like we discussed in our last post, about how historical data can help you make good trading decisions, we are here to discuss the historical volatility indicator that forecasts the dispersion (distribution of an asset) in the financial markets such as crypto and others. Without further ado, of your precious time, let's get started.
| Historical volatility indicator |
|---|
 Tradingview
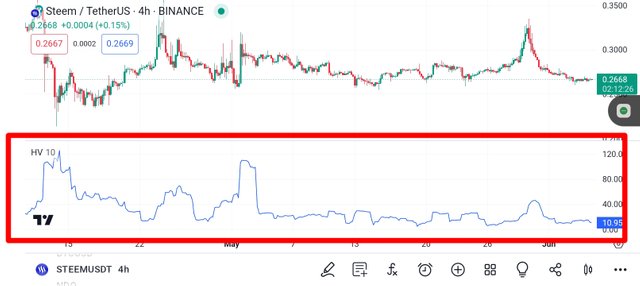
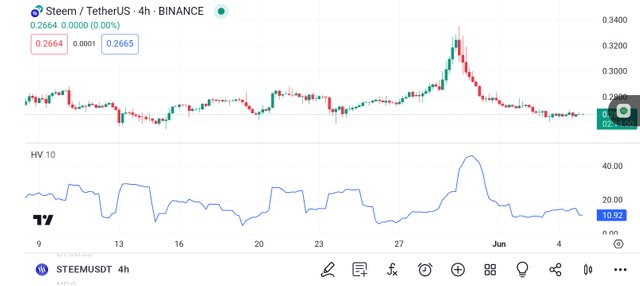
By mainly looking at the chart to which we have applied the historical volatility indicator as indicated in the screenshot, you will see that the indicator has spotted the point at which the price of STEEM/USDT deviated from its average.
With what we have seen from the screenshot it is now clear to us that the historical volatility indicator is an indicator that helps us to know how volatile an asset can be at the moment of checking by comparing the asset with its historical average. In other words, historical volatility is used to measure how far an asset has moved away from its value which is known from the use of the moving average.
Most traders, take the historical volatility indicator to be a statistical volatility because of the calculation and the use of moving average when you want to know the current price of an asset.
| Calculation |
|---|
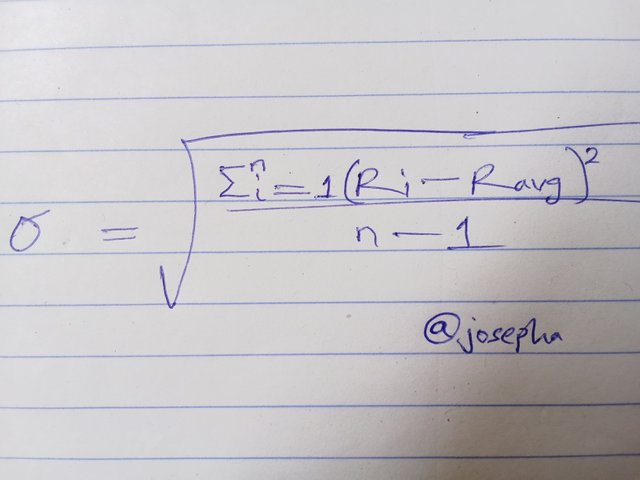
The formula which is stated above on the paper is what is used to calculate historical volatility. However, it is a bit confusing when calculating historical volatility, which all you have to do is apply the indicator on your chart first so you can be able to predict the future price movement of the asset you are analyzing.
In the given formula, R avg is the average of how the asset has returned daily, whereas R sub stands for continuously compounded return for each period of the asset.
| What Does Historical Volatility Indicator Tell Me |
|---|
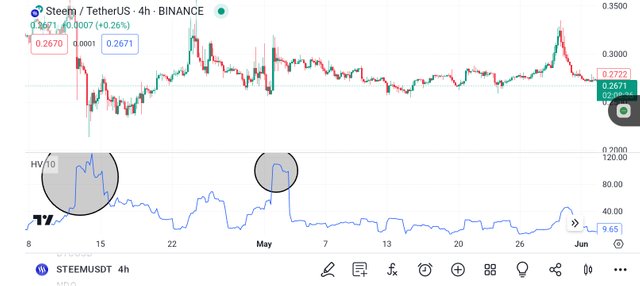
Historical volatility is an indicator that tells you about what is happening in the crypto market particularly the asset you want to know more about.
 Tradingview
It doesn't tell you about when you are to enter or exit the market nor tell you about the level of overbought and oversold, which if you want to know when you are to buy or sell and as well know about the levels overbought and oversold you will need to combine it with other indicators like RSI and MA indicators.
In the historical volatility indicator, if you see that it is rising, then you should know that the asset is becoming volatile, and you have to find out the reason why the market is becoming too volatile to position yourself better in the market.
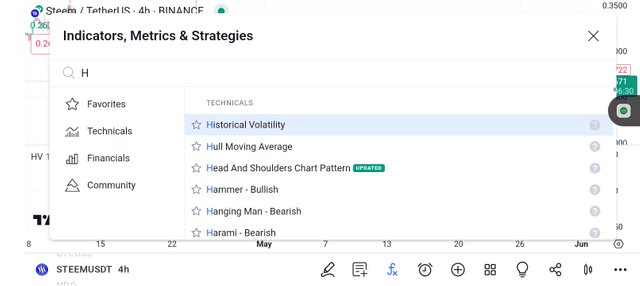
| How to Add HV into your chart |
|---|
Tradingview
It is very easy to insert HV into your chart, and all that you need to do if you are using Tradingview is to select a currency pair, head over to the indicator bar, search for the historical volatility indicator, and select it.
Tradingview
After you tap on the indicator name, it will be added to your chart automatically, which you have to minimize and go back to the chart.
Disclaimer
A historical volatility indicator, helps you know what is happening in the market, by comparing the current price and past price of the asset you have chosen to analyze. Note, that this post, is not investment advice but serves as educational content.
Thank you, friend!


I'm @steem.history, who is steem witness.
Thank you for witnessvoting for me.
please click it!
(Go to https://steemit.com/~witnesses and type fbslo at the bottom of the page)
The weight is reduced because of the lack of Voting Power. If you vote for me as a witness, you can get my little vote.
https://x.com/AkwajiAfen/status/1798242927547953293
Note:- ✅
Regards,
@jueco