An Introduction to Donchian Channel Indicator
Friend today we are to discuss an indicator that you can use and check how volatile the market is before placing a trade. The indicator that we will be looking at here is the "Donchian Channel Indicator" which has been existing in the financial for years. Without further ado, let's go deeper so we can know how to use the DC indicator.
Donchian Channel Indicator
Every technical indicator has been developed by humans which in the case of the Donchian Channel is Recharge Donchian that is behind the development of the indicator.
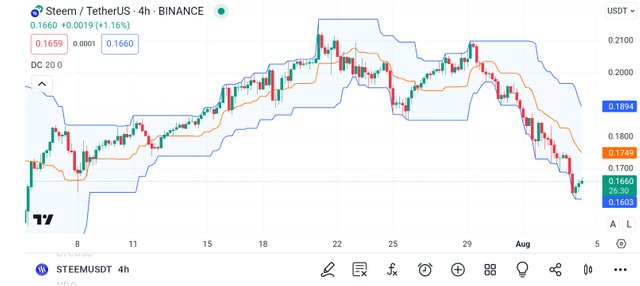
DC is the short name that is used to call the Donchian Channel Indicator which in the screenshot image we have shared you will see how it is written as DC. It is a very important indicator that is mostly used in a range of markets which helps you to know the volatility of the market.
Tradingview
Looking at the chart on which the DC is been applied you will see that DC consists of three (3) bands. Among the three bands which you have seen in the chart, the middle band is the average of the lower and upper channel lines. As we have earlier said, it is an indicator for checking market volatility which you can take advantage of.
Talking about the three (3) bands, it is the upper band that stands for the highest price movements of an asset, while the lower band, is the line that stands for the lowest price movements of an asset. The DC is the point between the upper band and the lower band.
Calculation
It is very easy to calculate the DC indicator and all you have to do is to look at where the DC is plots from which is usually from the highest high and the lowest low of the last "n" period.
The "n" period is based on the choice of trader, but the default period is 20 20-day period.
Upper Band = The Highest High in the previous n periods
Lower Band = The Lowest Low in the previous n periods
Median Band = ((Upper Band – Lower Band))/2)
Uses
As a trader, you can use the DC to trade a breakout, pullback, and reversal in the market. Let's talk about breakout.
Breakout
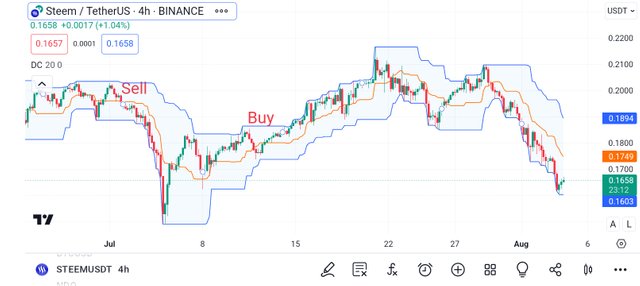
Tradingview
You can use the DC to identify breakout to know if you are to go long or short. Having said so, when you see that the price of the asset is trading higher than the DC, then you can go long and take your profit or go short when you see that the price of the asset is below the Donchian Channel.
Middle bands
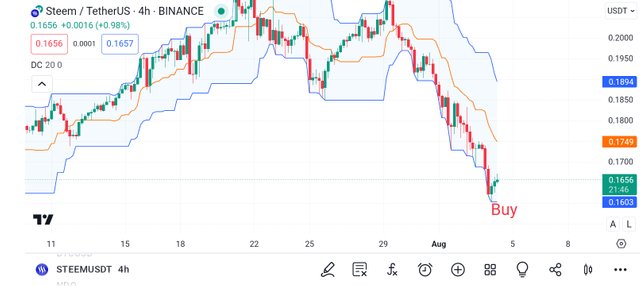
Tradingview
If you are looking at the middle line, you can open a long position when you see that the price of the asset has risen above the middle band. A short position can be open when you see it oppositely. I.e when the price of the asset is trading below the middle band of the DC
Disclaimer
The Donchian Channel Indicator is what we have finished discussing in this post, It is a market volatility indicator you can use and know how volatile the market is before opening a trade. Note that this post is purely written as an educational content.
Thank you, friend!


I'm @steem.history, who is steem witness.
Thank you for witnessvoting for me.
please click it!
(Go to https://steemit.com/~witnesses and type fbslo at the bottom of the page)
The weight is reduced because of the lack of Voting Power. If you vote for me as a witness, you can get my little vote.
https://x.com/AkwajiAfen/status/1820002106821968223
Note:- ✅
Regards,
@theentertainer