An Introduction to Connors RSI Indicator
In the financial markets, there are thousands of indicators that you can use and analyze the market before entering or exiting the market. Each indicator has what it offers to users and indicators like the Connor RSI can helps you identify short-term movement of price and help you to improve your position. Here we will be discussing the Connor RSI.
| Connors RSI Indicator |
|---|
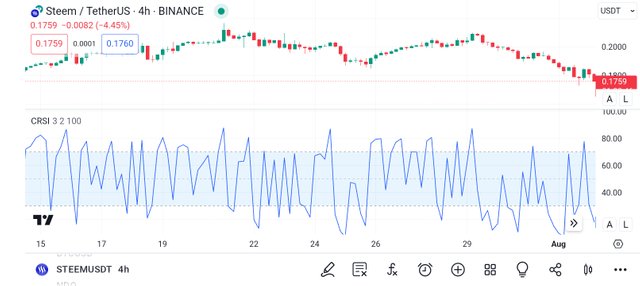
CRSI is the shirt name that is used to identify the Connors RSI Indicator which was introduced by Larry Connors. The purpose as to why the developer had to develop CRSI is to offer traders a better way to identify the change in short-term price movements. When you take a look at the CRSI you will see that it is familiar with the RSI Indicator.

Tradingview
As a trader when identifying overbought and oversold levels, in the case of the CRSI, an overbought level is when the CRSI reaches the level of 90 above, whereas an oversold level is when the CRSI falls below the level of 10 below. With all that we have discussed, it means the CRSI is an indicator that combines RSI with the components of overbought and oversold levels to provide you with accurate results.
The levels of overbought and oversold that the CRSI provides for users are what can help you to know when an asset might be sure for a pullback or a reversal (when to enter the market, and when to exit the market).
| Calculation |
|---|
It is very easy for you to calculate the CRSI indicator and all you need is the formula that would guide you through the three steps of calculating the CRSI indicator. Having said that, below is the giving formula.
Connors RSI (3,2,100) = (RSI(3) + RSI(Streak,2) + Percent Rank(100)) / 3
You can follow the steps shared below.
Step 1: You have to first calculate the RSI by determining the standard 3 period of the RSI
Step 2: You have to calculate the up/down streak of the RSI which you have to do this by evaluating the RSI based on the streak length.
Step 4: At this point, it is the magnitude of the price change you will need to calculate by computing the price change magnitude over the specified period.
Step 5: At this final step, combine the values. These are the three (3) RSI values to arrive at the final CRSI RSI.
| Strategy of CRSI Trading |
|---|
The CRSI RSI Indicator can be used to trade both a reversal and a pullback as we have earlier discussed. When you are analyzing the crypto market using the Connors RSI Indicator you need to be aware of the current market price of the asset so you can be able to apply a strategy that would work best for you.
Having said so, within a trend-based strategy of CRSI RSI, we would identify bearish pullbacks within the area of an uptrend so you can do that yourself to know when to go long or short.

Tradingview
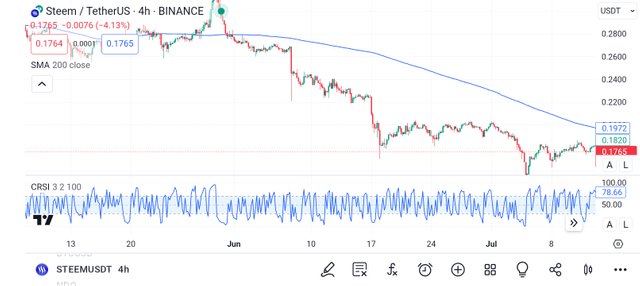
Looking at the above chart, you will that the 200 period SMA (simple moving average), and the CRSI RSI Indicator is applied in the chart. The 200 period SMA is the blue line that is within the price chart, whereas the CRSI RSI is in the lower pane as even in the screenshot. Looking at the chart you will see that the prices of STEEM/USDT are trading below the 200 period SMA indicating a downtrend market.

Tradingview
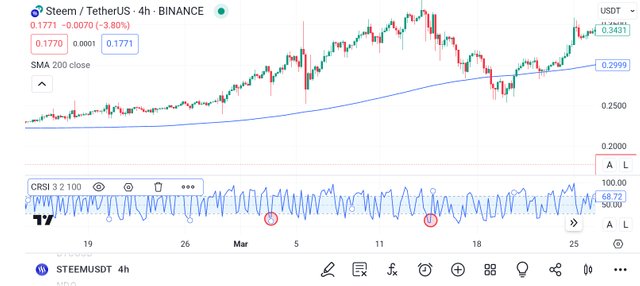
The area where the price of Steem/USDT was trading above the 200 period SMA is an indication of an uptrend market. On the other hand, looking at the screenshot, you will see where the CRSI RSI is been circled which is an indication of an oversold level.
Disclaimer
Here we have learned what Connors RSI Indicator means which you can make use of the reading of the CRSI RSI to enhance your trading skills. Please note that this post is not educational, as it is purely written as an educational content.
Thank you, friend!


I'm @steem.history, who is steem witness.
Thank you for witnessvoting for me.
please click it!
(Go to https://steemit.com/~witnesses and type fbslo at the bottom of the page)
The weight is reduced because of the lack of Voting Power. If you vote for me as a witness, you can get my little vote.
https://x.com/AkwajiAfen/status/1819263333758845156