An Introduction to Chande Kroll Stop Indicator
To minimize your risk based on market volatility, the Chande Kroll Stop Indicator is the best indicator that you can use for minimizing your trading risk whether you are going long or short. Identifying stop loss is what makes the Chande Kroll Stop Indicator so special to traders, and in this post, we will be talking more about the indicator.
| Chande Kroll Stop Indicator |
|---|
Let's start with the history behind the Chande Kroll stop indicator. It is an old indicator that was rebranded to suit traders' needs and was developed by two notable individuals named; Stanley Kroll and Tushar Chande. It is the combination of the last name of the developers that gives the Chande Kroll which is an indicator that is designed to help traders identify a potential stop loss for either a short position or a long position.
From the little we have discussed, it is now clear to us that Chande Kroll Stop is an indicator that allows us as traders to identify a potential stop loss for either the long position or short position we want to open or have already opened. Stop loss simply means an order that permits (allows) you to stop your loss at a certain price level. With the help of Chande Kroll stop, as a trader, you can safeguard your capital from being liquidated and allow your trade to keep moving in your direction.
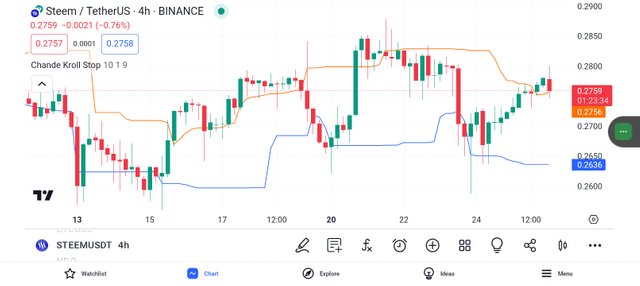
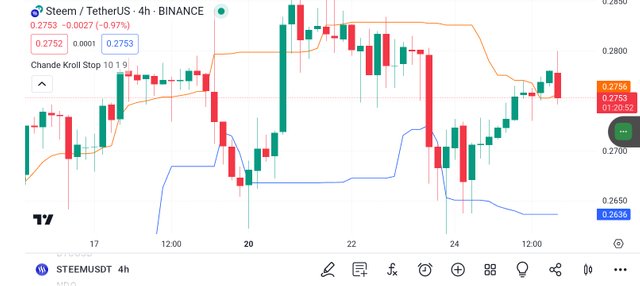
Chande Kroll Stop Indicator has two lines which are color in green and red, but can sometimes change to blue color which is the line that is overlaid on the chart. The Green/Blue line is the line that represents a stop for a long position, while the Redline is the line that represents a stop for a short position. This simply means that green is used to identify potential stop loss when a long position is open, whereas red is used to identify potential stop loss when a short position is open.
| Calculation |
|---|
Chande Kroll Stop is calculated based on the average true range of price volatility in conjunction with the market trends. This means the stops for low points and high points on the chart need to be obtained first, and the true range must stand as the true value. As for the true range three values which are shared below are seen in the true range.
Current bar high — current bar low;
Current bar high — previous bar close;
Current bar low — previous bar close.
Stops are put under or on the current bar high or current bar low of the chart's Last "n" bars. The difference is equal to the average true range on the "n" bars and the numbers gotten are used appropriately. The given formula below is the formula used for calculating the Chande Kroll Stop Indicator.
Initial high stop = HIGHEST [p] (high) – x * Average True Range [p]
Initial low stop = LOWEST [p] (low) + x * Average True Range [p]
Short stop = HIGHEST [q] (Initial high stop)
Long stop = LOWEST [q] (Initial low stop)
When you see that the price of the asset you are analyzing has crossed below both lines, it means it is a sell signal, while when you see that the prices of the asset have crossed above it means it is a buy signal.
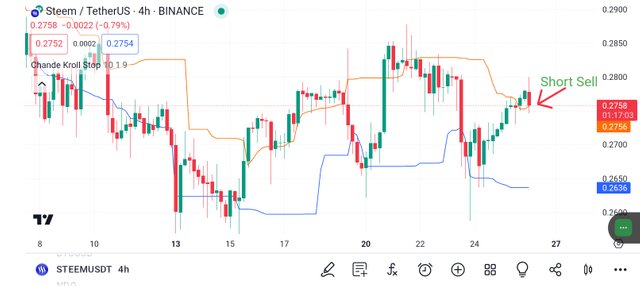
As a trader being aware of the position of the lines is the best way you can place a successful trade, you have to ensure that you are trading in the direction of the market trend and not just because you have seen a signal.
Finally, as a trader, you can use the indicator to stop trend changes. Like for example, when you see that the green/blue lines have crossed above that of the red line, you should know that a new uptrend is indicated, whereas when it is the red line that crosses above the green line, you should know that a new downtrend is indicated.
Conclusion
Today, we have discussed what you should know about the Chande Kroll Stop Indicator which is best used for minimizing risk when opening long or short positions. Note: this post is not financial or investment advice, but educational content that is written to educate you about the Chande Kroll Stop Indicator.
Thank you, friend!


I'm @steem.history, who is steem witness.
Thank you for witnessvoting for me.
please click it!
(Go to https://steemit.com/~witnesses and type fbslo at the bottom of the page)
The weight is reduced because of the lack of Voting Power. If you vote for me as a witness, you can get my little vote.
https://x.com/AkwajiAfen/status/1794597329670115489
Note:- ✅
Regards,
@theentertainer