An Introduction to Bull and Bear Power Indicator
Two special forces control the financial markets, which buyers' force is known as bull power, and the seller's force is known as bear power. Friends we are here to learn how to measure or better still know the difference between these forces in the market.
| The Bull and Bear Power Indicator |
|---|
Alexander Elder is the developer of this indicator we are here to discuss it. It is an indicator that helps traders to know who has more strength in the market, whether it is the buyers (bulls) or the sellers (bears) who have the most powerful strength. In determining this indicator, check the difference between the highest price an asset has moved against the EMA.
Tradingview
In summary of what we have so far discussed, the bull and bear indicator is an indicator that helps you to determine buyer strength versus seller strength in the market whenever you want to know. Without further ado, let's look at how the bull and bear function.
The Bull Power
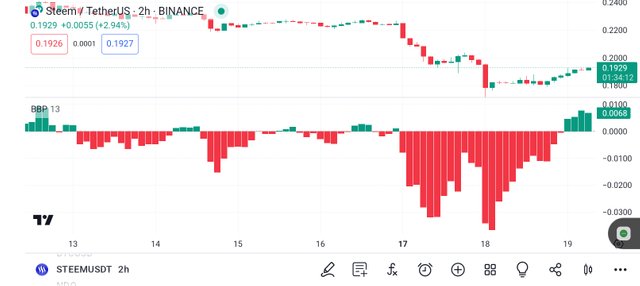
As we have discussed earlier the buyers are the bull power, which if you see that the indicator is moving above zero (0) (High > Exponential Moving Average), it simply means buyers force have pushed the market up and were able to maintain the highest price above the exponential moving average (EMA).
Tradingview
At this point, what you will see is a buy signal and the bull power moving above zero (0). However, a circumstances where the bull power is moving below the zero (0) (High < Exponential Moving Average), it simply means the seller's force has pushed the market below the Exponential Moving Average (EMA).
The Bear Power
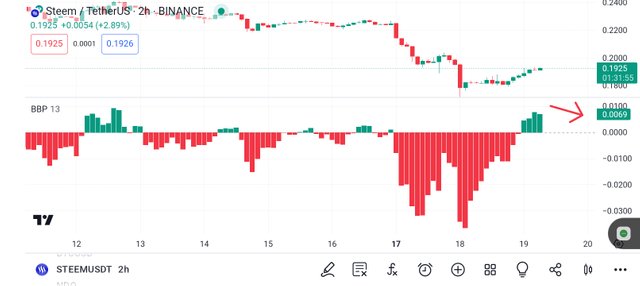
As we have discussed earlier, the sellers are the bear power, which if you see that the indicator is moving below zero (0) (Low - Exponential Moving Average), it simply means sellers force have pushed the market below and were able to maintain the lowest price above the exponential moving average.
Tradingview
The bear power has no upper or lower limit in the market but has a value of zero (0). Without further ado, the bear power is the opposite of the bull power.
| Entry points: |
|---|
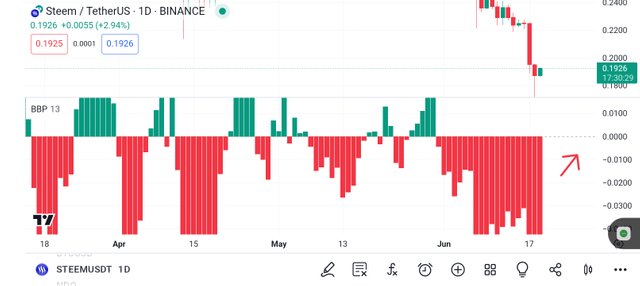
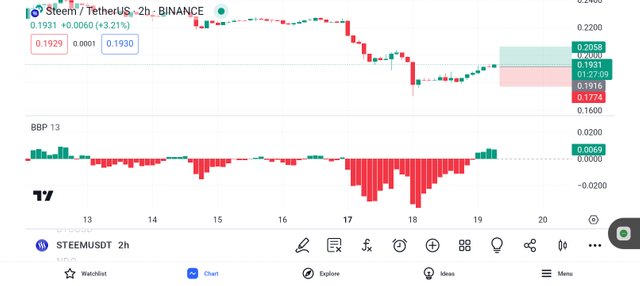
As a trader who wants to use this indicator to analyze before entering the market, you should go long (buy) when you have seen that the histogram is moving above zero (0) and the high price is higher than the Exponential Moving Average (EMA). Well you know sometimes the market can be so confusing that when you see that the histogram falls below zero and the high price is moving below the EMA you should exit the market because the price of the asset is decreasing.
Tradingview
As for the bear power, which is all about selling, watch out for when the histogram is located at the bottom of the chart which is now zero, and when the price is lower than the Exponential Moving Average. Since the market can be confusing most time, you can exit the market when you see that the histogram rises above zero and the low price moves above the exponential moving average which is an indication of a price increase.
Disclaimer
Today we have learned about the bull and bear power which has helped us to know how to determine who is in control of the market. Note that this post is not investment advice, but serves as educational content.
https://x.com/AkwajiAfen/status/1803315931264811392
Note:- ✅
Regards,
@jueco