A Guide To Average Directional Index (ADX) Use Cases
As a trader who wants to know the market strength of trends, I would say that the Average directional index indicator is the best tool that can provide you with the information that you need to know concerning the strength of trends which this post has talked about more on the indicator ADX.
| Average Directional Index (ADX) |
|---|
This is a technical analysis indicator that was developed by a man called by named Welles Wilder J to allow traders determine the market strength of a trend of any digital assets like cryptocurrencies. This implies that traders are using ADX to determine the strength of a trend you can also use the indicator to determine the strength of trends of any cryptocurrency that you want to analyze before entering the market.
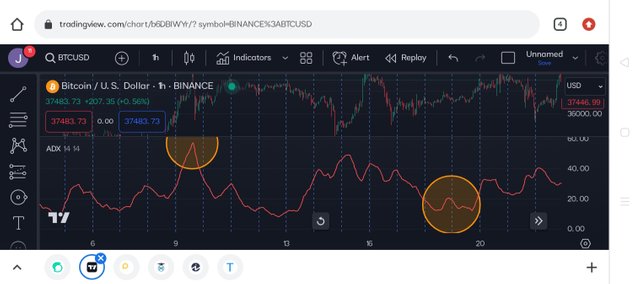
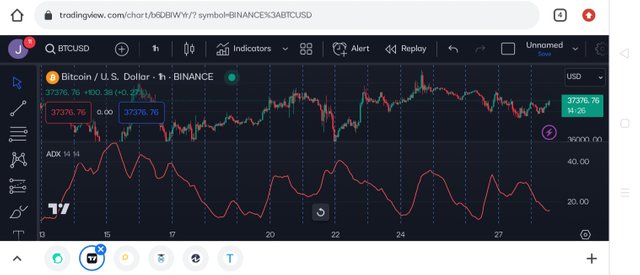
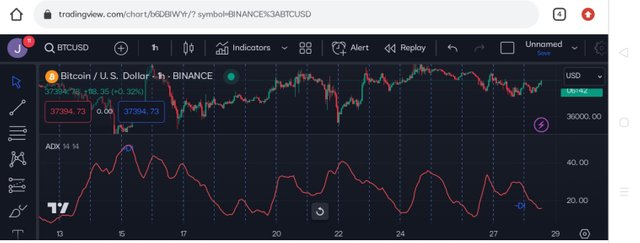
Talking about using the indicator to determine the strength of a trend, by the time you have applied the Average Directional Index in a chart via a platform like Tradingview, you will see an upper trend or downtrend as it is shown in the chart below.
By looking at the above, you will see how the Average Directional Index is displayed, having both negative (-DI) and positive (+DI directional indicators.
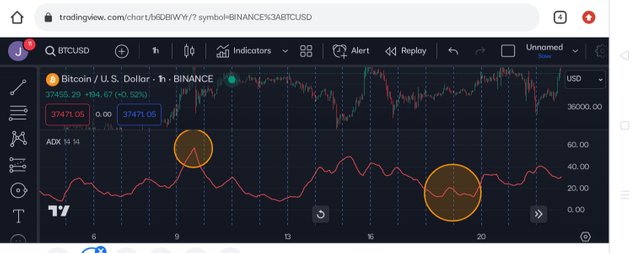
Now when you are using the ADX indicator and you see that the trend has swing from Zero (0) to hundred (100), whereas the reading is below twenty (20) you should know that it is an indication of a weak trend, but if the reading is above fifty (50) you should know that it is an indication that the trend is a strong one.
| How to Calculate Average Directional Index (ADX) |
|---|
As a trader who wants to use this indicator for calculating, you should first know the aim of the indicator which is to know if the asset you are analyzing is stuck in a range of trending in a direction that is either up or down.
Looking at the chart you will see the lines as we have earlier said and among the lines positive and negative lines
Positive Directional Index (+D): This means the strength is strong which is calculated by subtracting (-) the prior day high from that of the current day high.
Negative Directional Index (-D): This means the strength is weak and it is calculated by subtracting (-) the prior day low from that of the current day low. What is shared below is the formula based on what we have discussed here.
ADX = 100 × ( +DI - -DI) / (+DI + -DI) / ATR
| How you can read the Indicator |
|---|
This indicator shows you the strength of the trend of an asset notwithstanding whether the asset is moving in an upward or downward trend.
The scale of the indicator is read from 0 to 100 which means the stronger the strength of a trend when it is from 50 and above.
When you see that the ADX is below 20, it means the market is weak and not it's not trending.
When you see that the ADX is above 20, it means that a new trend is starting.
When you see that the ADX is between the range of 20 and 40, it means there is a confirmation of a starting trend.
When you see that the ADX is from 40 and above, it means the trend is strong.
When you see that the ADX has crossed 50 and above, it means the trend is strong enough.
However, when you see that the ADX has crossed 70 and above, which hardly happens, it means the trend is very powerful.
Conclusion
Are you a trader who wants to know how strong a trend is, ADX is the best indicator that you can use to determine the strength of a trend which we have possibly discussed in this post with tips on how you can read the indicator. Note; this post only serves as an educational post and nothing else.
Reference, Reference, Reference, and Tradingview


https://x.com/AkwajiAfen/status/1729502413118120137?s=20
Dear @josepha ,
We appreciate your active participation and contributions to our community. To ensure a positive environment for all members, we have implemented a set of guidelines to maintain respectful and constructive discussions while upholding community guidelines.
This is an interesting post on a guide to average directional index use cases, keep sharing quality post in the community
Now Engage, Connect, and Inspire Each Other to Reach New heights.
Thank You.