An Introduction to Mass Index Indicator
As a trader, if you can be able to spot trend reversal, it means you have indirectly spotted a good entry for yourself because trend reversal is what you need to look out for to determine your entry and exit point. In spotting trend reversal, you can make use of "mass index indicator" which we are here today to learn about.
Mass Index
Before we begin, it is good for us to know the developer who brought about the mass index indicator, which is no other person than Donald Dorsey who developed the indicator based on the ideology of how reversal occurs in the financial markets, who believe that reversal happens when price range expands.
Tradingview
The Mass Index Indicator was developed so traders could have a way of predicting trend reversal by analyzing the changes in the price range of any asset that is traded in the financial markets. The indicator is used to predict price reversal as we have discussed earlier which as a trader you make use of the advantages and spot the trend reversal of the asset you want to analyse.
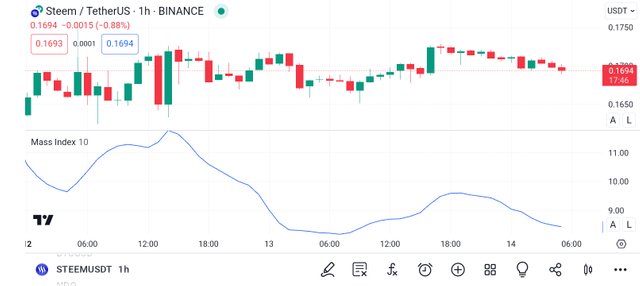
Having said that by mainly looking at the mass index as seen in the screenshot image we have shared, you will see that the indicator has only one line when the line moves upwards, it means there is a potential change in trend, but can't tell you the direction that the change will lead to. Also, you will notice that the indicator is shown below the price chart of the asset, Steem/Usdt.
Calculation:
For you to calculate the mass index indicator, you will have to make use of the formula shared below.
Mass Index = (EMA(9) of (High-Low) / EMA(9) of EMA(9) of (High-Low))
Based on the formula above, you will need to know what each of the words stands for. Having said that below is what they stand for:
EMA = Exponential Moving Average
Hgh-Low = It means the difference between the highest price and the lowest price of the asset for a given period.
9 = is a constant number that stands for a period that is used for calculating the EMA, although you can adjust the number and use any number of the choice.
Interpretation
Tradingview
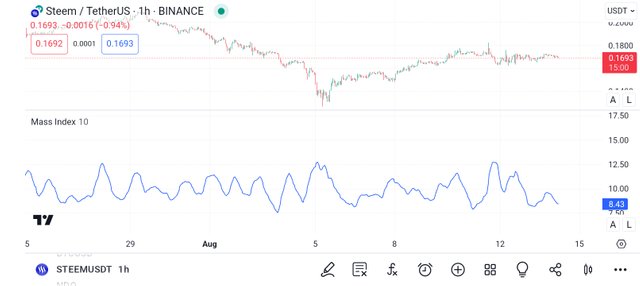
Let's take a minute and observe the above screenshot image. Okay, by mainly looking at the image you notice how the mass index is moving with the price of Steem/usdt going up and down.
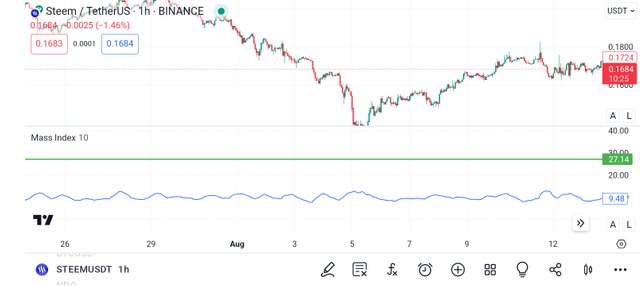
Now simply put, as we have discussed earlier we said it is used to identify potential trend reversal you will have to monitor the changes in the price range. To this, when you see that the mass index indicator is moving above the price range of 27, it means the price range is expanding (widening) and a reversal is about to happen.
Tradingview
On the other hand, when you see that the mass index indicator is moving below the price range of 27, it means the price range is narrow, which implies a continuation of the current trend. Based on what we have shared here, I am sure you have come to understand that the indicator does not provide traders with a direct signal, but it provides traders with a potential trend reversal.
Disclaimer
We are done with our discussion about the mass index indicator for today you should only treat this post as educational content and not as investment advice.
Thank you, friend!


I'm @steem.history, who is steem witness.
Thank you for witnessvoting for me.
please click it!
(Go to https://steemit.com/~witnesses and type fbslo at the bottom of the page)
The weight is reduced because of the lack of Voting Power. If you vote for me as a witness, you can get my little vote.
https://x.com/AkwajiAfen/status/1823599103894270012
Note:- ✅
Regards,
@jueco