What is Relative Strength Index (RSI) by jani786
As we all know, the cryptocurrency market is very volatile and diverse. Prices and asset values tend to rise and fall unexpectedly. Therefore, every trader, after entering the market, tries to find a safer and better way. There are many tools and commands available in each market when trading or viewing trading charts.

A lot of indicators and tools are available in the cryptocurrency chart menu which helps a trader or investor to make profit or loss in their trade by taking into account the entry and exit of any market. So RSI is also an indicator that helps traders while trading in any market.
RSI (Relative Strength Index):
RSI stands for Relative Strength Index and is an indicator available during market trading that is used to help traders make better profits and protect traders from sudden losses. The RSI indicator determines the future price of each asset, i.e. when the price of the asset will rise, and thus helps and actually helps traders to earn better. Since the crypto world market is very volatile, this indicator is very useful for traders.
Calculation:
RSI is an old indicator that was developed almost forty years ago. RSI is a momentum indicator that uses a very complex formula to help users determine whether an individual asset (cryptocurrency, token or coin) is overbought or oversold. RSI is calculated using this complex formula as follows:
That is what is interesting and impressive about the RS term in this formula. Here, RS is the ratio of average income for a given period to average loss for a given period.
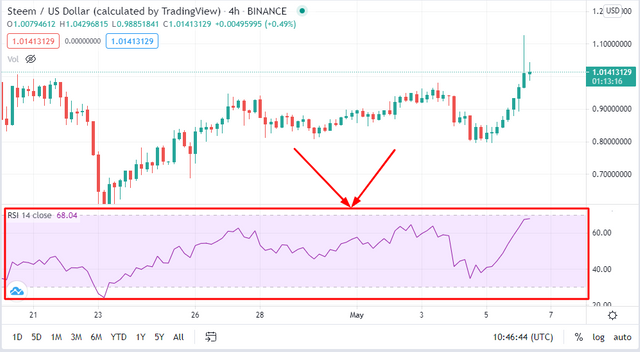
As you can see in the screenshot above. This is the relative strength index (RSI) of the STEEM/USD chart according to the Trading Dot Wave chart. The indicated areas show variable changes in the value of the STEEM token.
As we all know nothing is perfect in the world. All pictures have two sides, one side shows the virtues and beauty of the picture and the other side shows the ugliness and justice of the picture. The same is the case with the RSI (Relative Strength Index) indicator in the cryptocurrency market and the stock market.
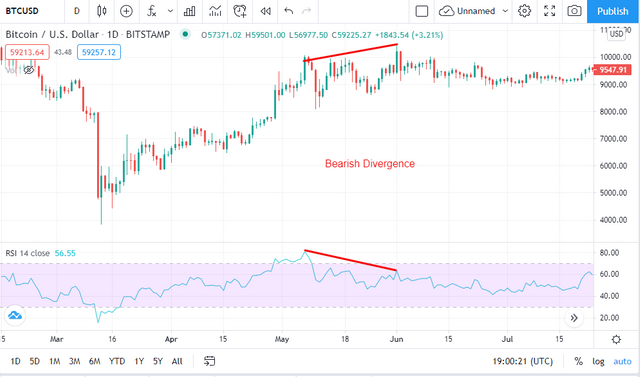
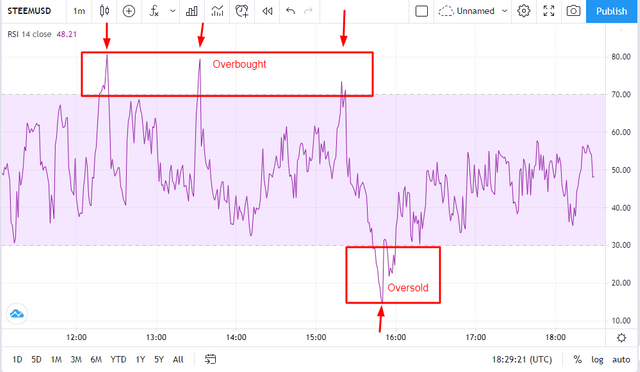
As we have already discussed, RSI is an indicator that is actually an oscillator that determines the market trend of each asset pair by taking into account the ratio of oversold to overbought. This tool can be very important and useful in trading while connecting with other tools and oscillators available on trading charts.
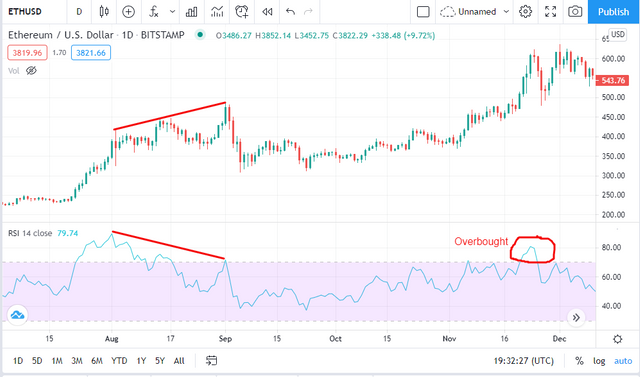
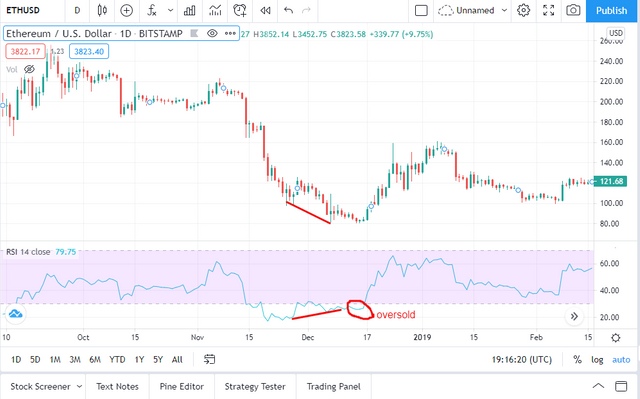
The RSI indicator shows the oversold and overbought market trends of the respective assets, and although it depends on the experience and performance of the traders, this indicator helps traders to prevent sudden losses and overvalue the assets. Can be more useful and reliable to help. More than enough.
RSI Indicator Configuration
Now we will discuss how we can adjust the RSI indicator on each asset crypto.
- First, open a chart of any asset pair in the TradingView chart viewer, as I have opened a chart that is built between STEEM/USD. Click on the fx tool on the top panel.
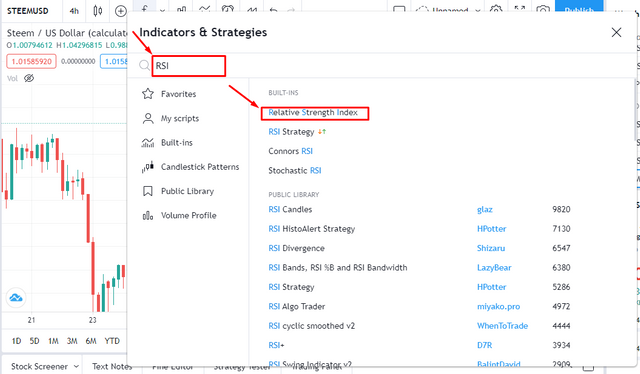
- Here, in the search bar, search for RSI and click on the Relative Strength Index option.
- You will see the RSI indicator at the bottom of the chart page.
So, here is how to set the RSI indicator on the chart.
As we know, the RSI indicator is actually an oscillator whose length is 14 units by default. The width of the RSI indicator depends on the time unit you choose for the chart. For example, an RSI chart with 1 time unit says its RSI length will be 14 days.
The RSI value is always between 0 and 100.
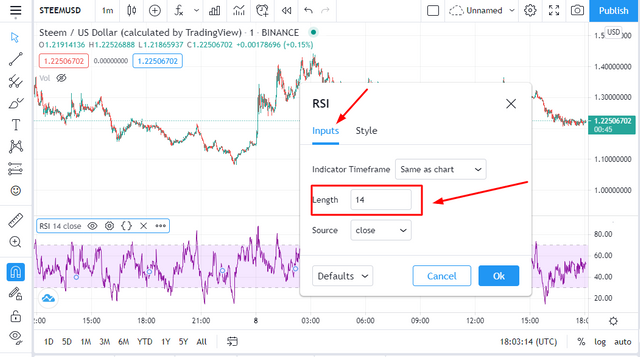
The default length of the RSI indicator is 14 units, but we can change the length of the RSI indicator by doing the following:
- Double click on the line that appears on the RSI indicator.
- After double clicking on the line you will see a menu bar and in this menu you will see the default length of RSI line which is 14. You can edit or change any length and click OK button at the bottom of the menu.