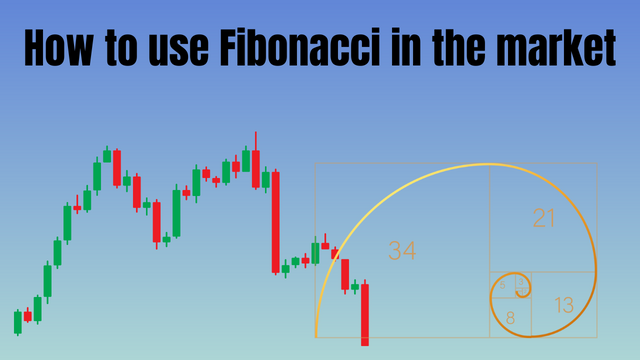
Learn to use Fibonacci in the market.
I'm so happy to be able to meet again with Steemian's friends this time.
In the previous material, we have discussed quite a lot about market structure.
In this edition, I want to discuss one of the tools that is important, and of course, I always use it when analyzing the market, both crypto and forex markets.
Fibonacci is an indicator in the form of a horizontal line used by traders to indicate future support and resistance points. Can also be used as a tool to find areas of supply or demand.
But many are still confused about using these tools easily.
The following are things you need to pay attention to when using these tools in a market.
In using Fibonacci, we need to look at the market structure by looking at the swing points, like in the following picture.
In the picture above, you can see the demand area at the fibo level of 0.75.
Maybe you are wondering why I chose to use the 0.75 to 0.88 levels as a premium and discount area in determining good supply and demand as well as support and resistance.
Back to the basic concept of economics, namely, the premium price is the price used to sell goods, and the discount price is the low price to buy an item.
The use of fibo levels of 0.75 to 0.88 is a premium and super premium level in a market area, which is also supported by the existence of a supply or demand area.
In the following, I will give a concrete example of using the premium Fibo level in a bearish market combined with the supply area.
In the SUI market as above, it can be seen that the supply area is at a premium level, namely 0.75 Fibonacci.
This is a great confirmation of a Fibonacci pullback from a swing high to a swing low in the bearish market position in the image above.
You can see that the price immediately corrected to touch the previous swing low and may have continued to decline.
This is a good use of Fibo levels when referring to the premium area in a bearish market and the discount area in a bullish market.
Conclusion |
|---|
Understanding how to use Fibonacci levels in a market structure will, of course, add more confirmation to our analysis or trading plan.
With more and more confirmations, such as a break of structure, supply, or demand, and the use of premium and discount Fibonacci levels, of course we will be more confident in the analysis we make in a trading plan setup.
.png)


Dear @gitshock.trading ,
We appreciate your active participation and contributions to our community. To ensure a positive environment for all members, we have implemented a set of guidelines to maintain respectful and constructive discussions while upholding community guidelines.
This is a nice explanation using fibonacci retracement tool but is your tool not too noisy?
Now Engage, Connect, and Inspire Each Other to Reach New heights.
Thank You.
thanks for your feedback.
for me this is very good, and less messy than other people's use of fibo, I also use fibo 0.3 to see the potential for a pullback when the market is very volatile.
the use of fibo depends on the typical trader, and I am very comfortable with this. if you see a mess, just forgive me, because this is my setting for me personally. can i see your fibonacci settings in your trading view account?
share via twitter
Nice posting!
Kegunaan fibo ini selain menentukan "pendapatannya banyak atau enggak" buat apa lagi ya? Aku kok sampai sekarang belum nemu
Pendapatan?
Masih belum paham maksud kamu kim.
Karena kegunaan fibo menentukan potensial area retracement berdasarkan premium dan diskon yang sesuai dengan history harga sebelumnya (terdapat demand atau supply)
Aduh. Ini penjelasannya malah bikin aku pusing.
Makasih, makasih, penjelasannya. Aku masih salah memahami kelihatannya. Karena ga tau juga sistem fibo itu gimana. Retracement jga belum paham hwahahaha. Pelan wes 😅
Besok lah siang" gmeet lagi kalau mau nambah referensi
Okee.
Besok kabar kabar lagiii