An Understanding Of The Japanese Candlestick
The Japanese Candlestick Chart
The japanese candle stick is one of the oldest trading indicator known to man and has it's origin as the name implies from japan and was used by traders to tracking the price of rice and a useful indicator for them to gaining understanding on the economic market and it's law of supply and demand that governs every market even digital rightly.
We all know that the market moves in two trends either in an uptrend or downtrend sometimes too it could have no direction just moving sideways. The japanese candle stick rightly shows or help us to understand that market movement is generally a reflection of traders emotion, yes if traders are feeling bullish they will invest and make the market moves in a upward trajectory, but if the are feeling fearful they will start pulling off their money and it will also impact negatively on the financial market.
The japanese candle stick is not just one of the oldest indicator but a very powerful and accurate one indeed because man's emotion rules the market. It's is used by traders and especially technical analyst in determining the trend of the market, when to exit or enter a position also.
The japanese candlestick plays a huge role or is a very accurate indicator that is widely to be successful in the financial market. This chart was developed in the 1700's by Munehisa Homma and has gone on to gain wide recognition worldwide and very valid up to our time and widely used by analyst and a useful tool for trading crypto derivatives and helps to provide a graphical representation of the prices of assets on the market and has proven itself to a very accurate indicator over the years that traders trust.
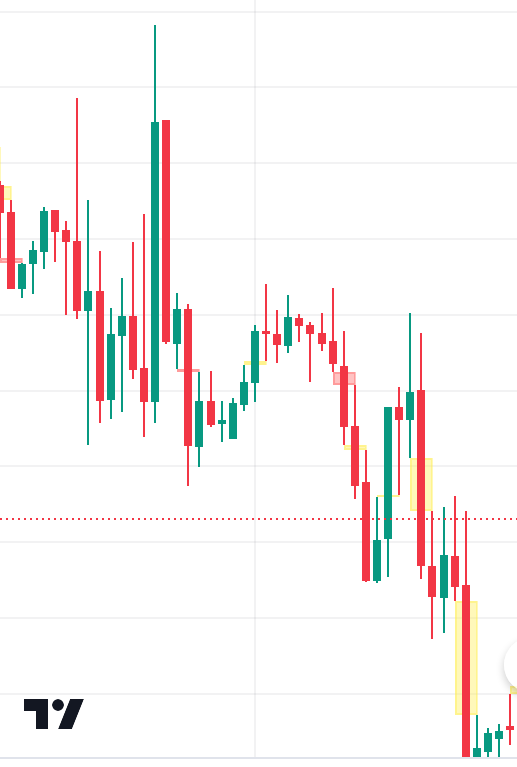
A graphical representation of what the japanese candlestick looks like below👇
Screenshot from trading view
Why The Japanese Candlestick Is The Most Used In The Financial Market
Well a trader can't be successful if he can't make a correct analysis on the market. He will be wrecked time and time again. Well for a trader too who has the knowledge he will still fail if he is wielding the wrong tool as guide to delve around the financial market. Making use of the wrong tool which leads to a misleading analysis would always leave a trader wrecked and won't be able to last longer in the financial market.
The japanese candlestick chart over the years have proven to be a powerful tool when wielded in the right hands by those who knows what they are doing. It is a very useful and precise indicator. It helps traders to make a thorough and accurate analysis on the price movement of an asset with it traders can discern the opening and closing price of an asset as well as the highs and lows which enables traders to know when to enter a trade and when to exit and take profit when necessary.
The inventory and introduction of the japanese candlestick chart and it's use by technical analyst and crypto traders have made it so they have little margin for error and make them to be ahead of the rest in the financial market by making use of this indicator to carry out a detailed analysis on the price movement of an asset, determining the phase a market is whether bullish or bearish depending on the emotions of investors whether they are very confidant and pouring money into the market or looking to take profit.
When traders utilise the japanese candlestick it helps them to be successful and helps them to gain proper understanding of the law that governs the market whether the traditional market or digital one that is the law of supply and demand. Which in turn help traders make an accurate prediction of the movement of the price of an asset and utilise this knowledge to make huge profits in the financial market. Because of the accuracy and the fact that this candlestick chart patterns are undoubted and a true reflection of the health of the market and it's being a powerful tool for this reason it is the most used tool by traders and technical analyst alike in the financial market
Bullish Candle
The bullish candle is usually denoted by green. This candle shows a market is in an uptrend or in good health. When the closing price of a crypto asset is higher than it's opening price that's mean the trend is upward an the market is bullish. When the market is green generally is a happy moment for everyone.
A Typical Example Of A Bullish Candle Below
Screenshot from trading view
The arrow in the image is pointed toward what we know as a bullish candle, we can see it's green.
Bearish Candle
This is is the candle that denotes when there is a sell off in the market by traders. When this happens a bearish candle usually forms. We usually say will say there is blood in the market when this candle forms continuously. It's usually a price reversal from a bullish candle. When the opening price is higher than the closing price when know it is bearish and hence a bearish candle is usually formed.
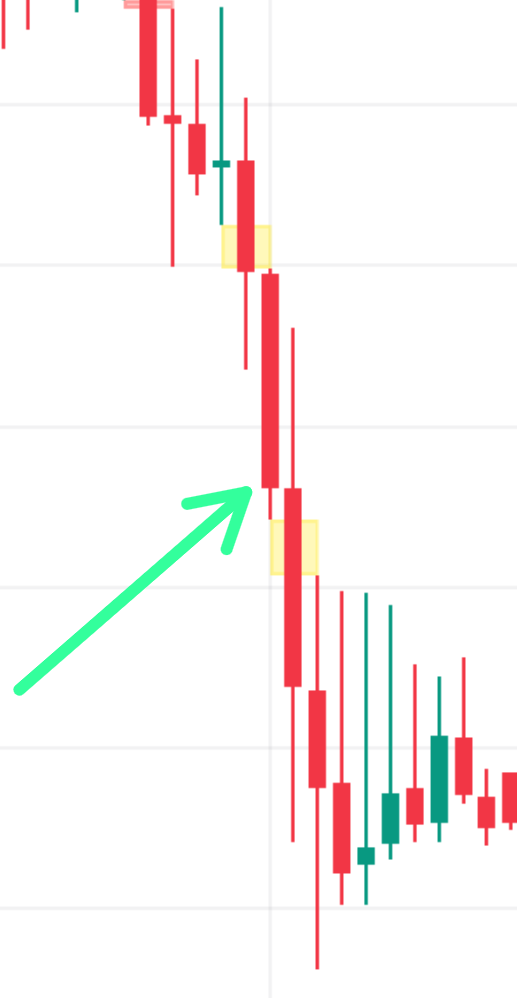
Example Of A Bearish Candlesticks below
Screenshot from trading view
The bearish candle stick is usually red as the image rightly depicts or shows.
The Anatomy Of A Bullish And Bearish Candlestick
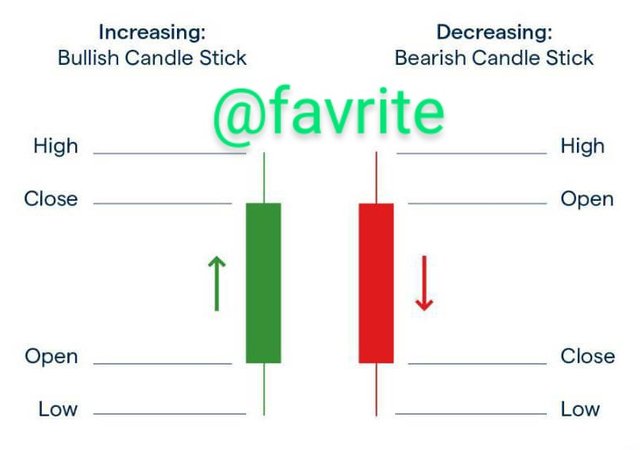
A candle stick genarally consist of the opening price, the closing price, the lowest and highest price. We shall talk about this below.
Opening Price: As the name implies it is basically the starting price point of a security/derivative. This is the price at which the asset first opens with before moving upward or downward. It is the very first price recorded in a given time frame
Closing Price: This is the price at which at which an asset closes. When a candle is formed the last price point recorded on the candle stick is the closing price. It's is the opposite of opening price.
Low: This is the least price of an asset obeserved in a formed candle stick in a given time frame.
High: This is the highest price point recorded on a formed candle stick chart before closing. The highest price observed on a particular candle stick before it closes is known as the high or highest price.
Conclusion
I believe harnessing the right tool is vital for a trader to be successful in the financial market and feel that the Japanese Candlestick is a pretty good tool for anyone to use and scale through and be ahead in the market. It is important that we use this indicator to help us thrive in the market. It's a useful tool indeed and one i find joy in using


