Try to find the BTC entry point using technical analysis || Steem Alliance Community.
Hello Everyone,

Good evening everyone, how are you. I hope you all guys will happy and good. By the grace of God, I am also good. Today I am here with new post in which I am going to do the technical analysis of btc and try to find an entry point.
Future trading is the exciting and challenging especially when it comes to volatile pairs like BTC/USDT at the time of CPI data. Recently, I made a strategic entry into this pair using a combination of technical analysis tool. Below is the detailed breakdown of my analysis accompanied by screenshots of charts.
Analyzing with 4th Hours timeframe:
In the first screenshot, I am analyzing the BTC/USDT pair on the 4th hour time period. This timeframe gives me a good indicator between short-term fluctuations and longer-term trends.
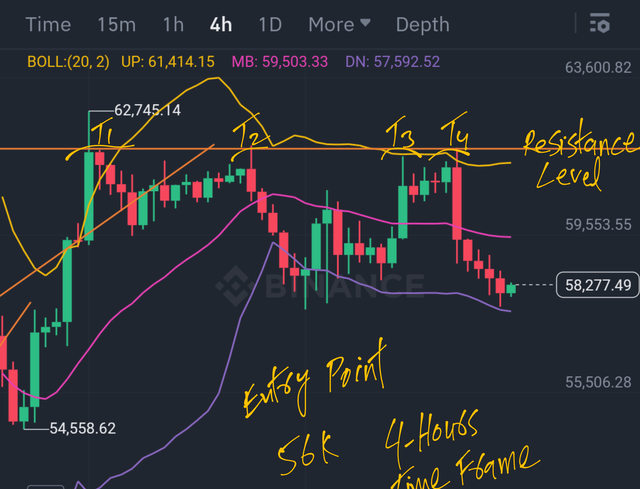
Price Movement
The price has been fluctuating between $54,558 and $61,800. As of my entry, it will hovering around $56k to 58k by indicating a potential retracement from the recent high. it is continually trying to break the 61K level but failed many time. you can see a clear price movement in the share screenshot.
Bollinger Bands
It is trading near the lower Bollinger Band which often suggest that the asset is oversold and could be due for a bounce.
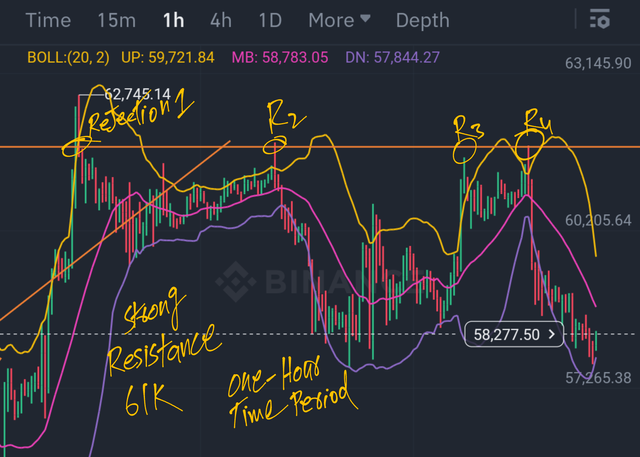
Confirmation with 1-Hour Chart
The second screenshot provides further confirmation of my analysis on the 1-hour timeframe. The price is indicating the consolidation around the $58,277 level which align with the support observed on the 4-hour chart.
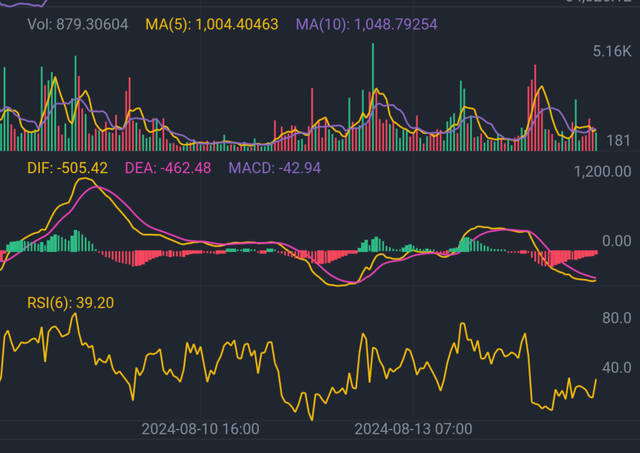
MACD
The MACD is in a bearish phase with the MACD line below the signal line but the histogram is starting to show smaller negative bars that is suggesting a potential reversal.
RSI
The RSI is at 40 which is not yet in the oversold territory but is close enough to indicate that a buying opportunity might be approaching. so my entry point is at 56k level.
I will entered into market at $56k by using stop loss that will $55K to manage my risk. My target is a return to the middle Bollinger Band on the 4-hour chart that is around $59500 to $60k where I plan to reassess the situation.
I hope it will be an interesting topic for crypto lovers. It would be my pleasure if you will share your opinion and reviews on this topic.

Please cast witness vote to @bangla.Witness or set proxy to @rme.
_
Vote @bangla.witness as witness
Set Proxy @rme as proxy
Special Thanks.
Cc: @rme
Cc: @hungry-griffin
Thanks for giving your precious time to my post.
Follow | Upvote | Share | Comments
Follow me on Instagram.
Instagram
🆃🅷🅰️🅽🅺 🆈🅾️🆄
X Promotion Link.
https://x.com/alimhr96/status/1824047725681512622?t=-53mrYJsmcpom2Zu22mhww&s=19