Scalping with Bollinger Band || Steem Alliance Community.
Hello Everyone,

Bollinger Band is a the most reliable and accurate technical analysis indicator that helps predict the price movements market in the crypto world. Their bands are used to make trading decisions. Bollinger Bands were developed by John Bollinger. Bollinger Bands have three lines when we implement it on chart . These lines helps to indicate the price movement of coin/token.
Types of Bands:
Upper Band.
Middle Band.
Lower Band.
Bollinger Bands helps the trader to identify potential price reversals and volatility in market. When the price touch the upper band, it indicate that market is in overbought condition and best opportunity for taking short position. When the price touch the lower band, it indicate that market is in oversold condition and best opportunity for taking Long position.
Upper Band:
The upper band is calculated one standard deviation above the middle band. Standard deviation corrects for volatility. The upper band shows volatility and shows traders where the price can move above the current trend.
Middle Band:
It is a simple moving average line which usually uses the 20-day EMA. This middle band represents the price trend.
Lower Band:
The lower band is also calculated as one standard deviation lower than the middle band. It shows how far the price can go below the current trend.
When the price touches the upper band of the Bollinger Band, it show the potential selling opportunity because the upper band usually give signals to overbought market conditions. At that point, the traders try to make a profit by selling. Bollinger Band indicator is most effective in daily scalping or sideways markets. If markets will highly volatile, it can lead and give false signals.
When the price touches the lower band of the Bollinger Bands, it show the potential buying opportunity as the lower band usually signals oversold market conditions. At that point, the traders try to make a profit by buying.
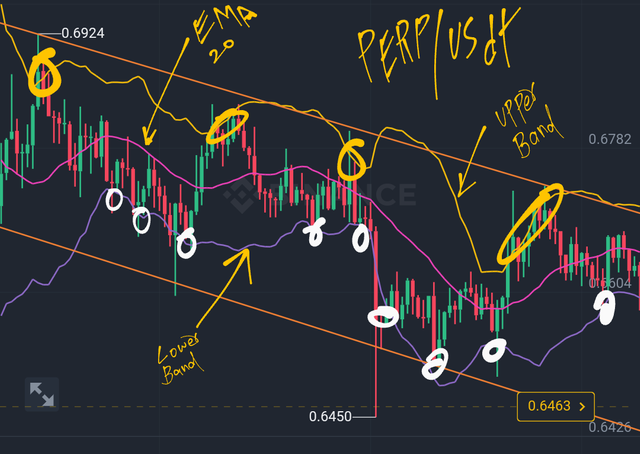
In the screenshot, we can see the downtrend of PERP/USDT pair. The opening price of 0.6924 to 0.65 confirms the downtrend. The upper and lower bands of Bollinger Bands are used as entry and exit points in a downtrend to get profit. But always remember that Bollinger Bands are an indicator But news factors and risk management are also important to understand while trading.

Please cast witness vote to @bangla.Witness or set proxy to @rme.
_
Vote @bangla.witness as witness
Set Proxy @rme as proxy
Special Thanks.
Cc: @rme
Cc: @hungry-griffin
Cc: @pennsif
Thanks for giving your precious time to my post.
Follow | Upvote | Share | Comments
Follow me on Instagram.
Instagram
🆃🅷🅰️🅽🅺 🆈🅾️🆄
https://twitter.com/ali51459952/status/1701570791308239198?t=M2qnNtS8vkFH5_Vr1B860Q&s=19