Technical Analysis Using Fractals
It is no news that the crypto market undergoes changes on a daily basis and price fluctuate due to forces of demand and supply. In splits of seconds, the price of an asset would go up and will also come down. Despite this changes, prices of assets tend to repeat similar patterns on the chart of which Traders through the use of technical analysis lay their psychology in Trading. Some good chart patterns are the double bottoms, Haramis, inverted harmer, double top etc
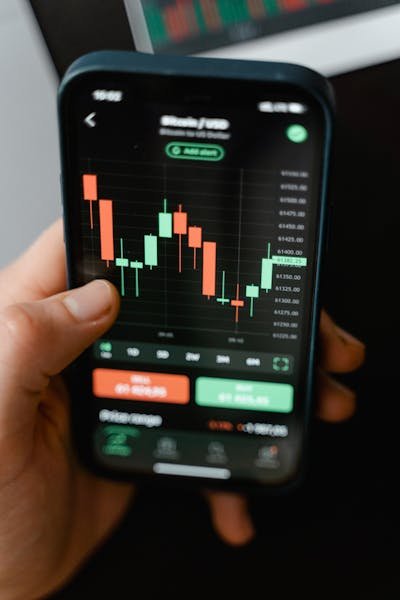
These chart patterns are seen on the chart on a daily basis and Traders base their trading decisions on this chart patterns. There is something called fractals which are known as repetitive patterns on the chart. This patterns can be bullish or bearish all depending on the movement of the market and psychology of most Traders are dependent on these fractals as they expect the market to have the same reaction when these patterns are uncovered on the charts.
Some indicators have been designed based on fractals that would help a trader identify these chart patterns easily. One of such indicators is the Williams fractal indicator which helps in identifying charts easily.
Rules involved in identifying fractals |
|---|
Are there actually rules or guidelines for identifying these fractals? Yes there are and this rules are meant to be respected when there is a risk involved. Violation of these trading strategy and pattern rules which governs the trending decision of every Trader will lead to making wrong investment decisions. So what are the rules involved?
- Fractals identified on the chart must rhyme with the trend of the market. **
Bullish fractals are expected to follow a bullish trend and bearish fractal is also expected to following a trend that is bearish. A fractal can signal a trend continuation or reversal based on where it is formed and the pattern as well.
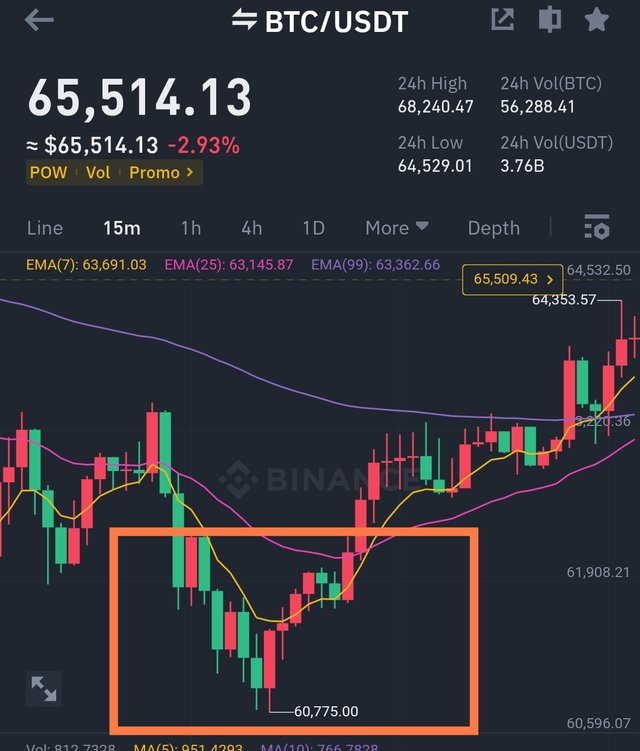
- For a bearish fractal, the middle candlestick must consists of a higher hi with two lower lows on each side of the candlestick that is in the middle. This is shown below. We can see that this screenshots follows the bearish fractal rules and this bearish fractal signals a reversal in trend in this situation accompanied by a movement that is bearish.
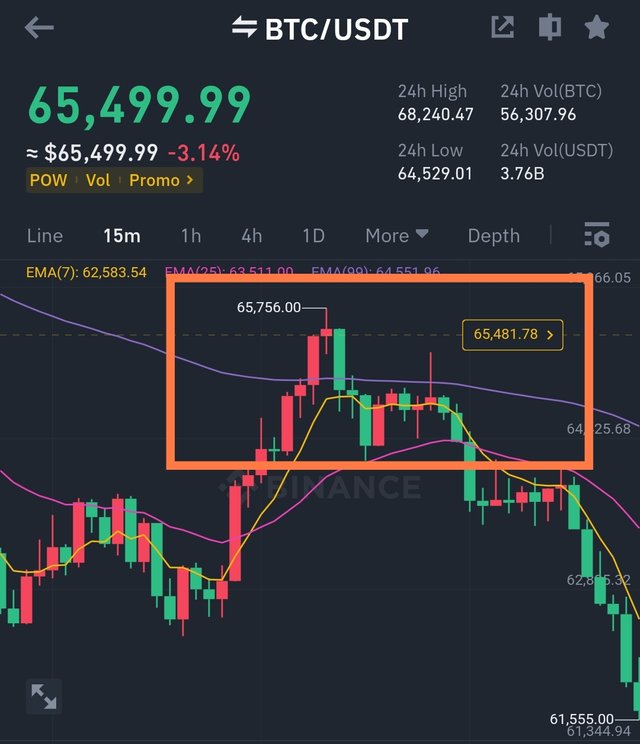
- For a bullish fractal, the reverse would be done and this occurs when the middle candles stick consists of a lower low with two higher high candlesticks on each side of the candlestick that is in the middle. In the screenshot below, we can see it follows the rules and it is accompanied by a movement that is bullish which leads to a trend reversal.
So in summary, for a pattern to be considered a fractal, it must consist of at least five candlesticks or more. The accuracy of the fractal is determined by the number of candles involved. The higher the number of candles, the higher the accuracy.
Indicators that can be used to identify fractals. |
|---|
It is not easy to identify chart patterns and also make trading decisions on them. Fractals are based on past prices or historic price data which may be difficult for a trader who uses basic calculations to determine such. Technical indicators have been set aside, developed using mathematical models of historic price data which helps one identify fractals on the chart. Williams fractal indicator is commonly used but there are others like fractal resistance and support and fractal breakout. Let us add an indicator and see how this works in identifying chart patterns.
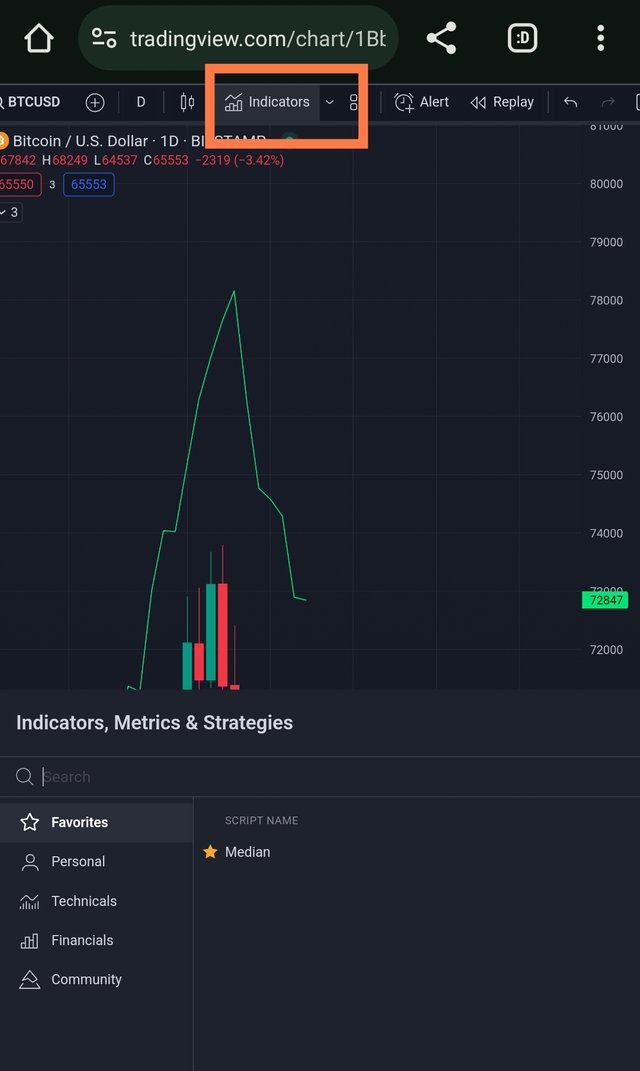
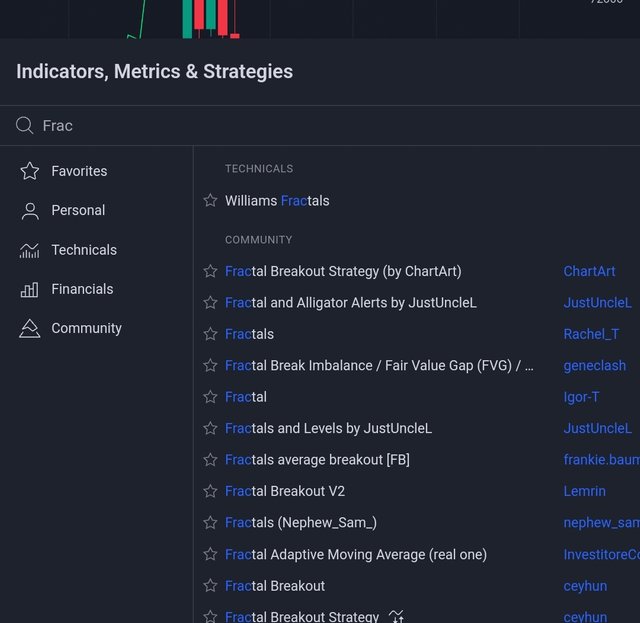
On the interface of the charts in tradingview, click on the fx indicator icon at the top page. When it opens, click on fractal which is my desired indicator and then I will search for Williams fractals to be added to the charts. This is shown in the screenshots below.
 |  |
|---|
How do these indicators work in identifying patterns easily especially when it comes to the Williams fractal? This question would be answered in my next post as it needs proper breakdown and elaboration.
Source: Tips from a crypto Enthusiasts 6 years back. All screenshots are from my binance and trading view.
Disclaimer :Any financial and crypto market information provided in this post was written for informational purposes only and does not constitute 100% investment advice. It's just basic knowledge every crypto trader or investor should have

https://twitter.com/bossj23Mod/status/1770941363992879515?t=57Zvg2lUEDRX5msa1dBbTQ&s=19
Note:- ✅
Regards,
@jueco
Thanks for the review