CTS 1: Effective Trading Strategy using Line Charts
Cryptocurrency Trading has lot of Strategies [CTS] that helps trading trade and be at the profiting end and minimize losses. To many, they prefer using complex Japanese candlesticks to identify market entry price but there's a more simple strategy as this one isn't that efficient that's why most traders fail or incur losses. Trading using line charts is an easy and effective strategy traders can use to be at the profiting end. How can this be possible and how can be this trading strategy be used to identify support and resistance?
Line Charts |
|---|
The line charts is a Cryptocurrency Trading method of graphical representation of the price of an asset or coin with time. This line charts gives traders a clear image of the price movement or path of an asset. It shows the change of information over a period of time and it gives only the closing price of asset which changes in time. Like I said, this line chart only show the chart pattern of closing price although both the asset's opening and closing price are connected using a single line with time.
Note: A line chart pattern is a 2D data representation. The horizontal line is time frames of these assets while vertical line is the asset price. And the beauty of the line chart is that it's easy to understand although most traders find it difficult to understand trends and movements in price due to the use of sophisticated chart patterns. This makes them fall on the loss and instead of the profiting end.
Line charts brings about a better way to understand these trends and price movements. You can also be on the profiting end using line charts instead of using complex chart patterns. These line charts contains only a single line and is enough to filter market noise as the closing price is easily identified. The reason why most retail trader fail is because they trend not to apply this strategy when trading.
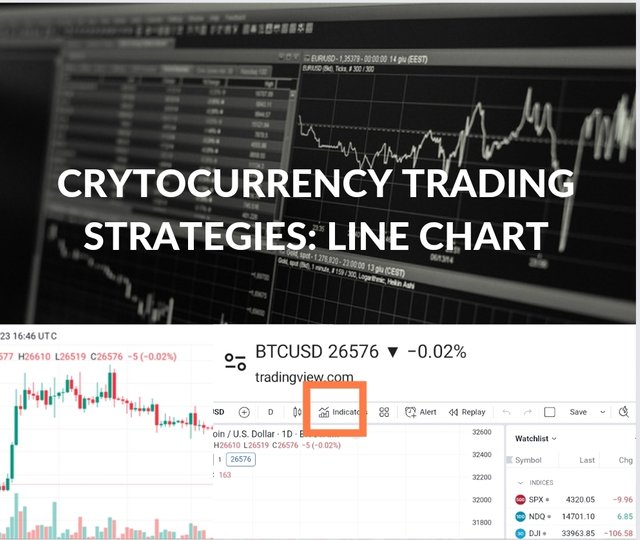
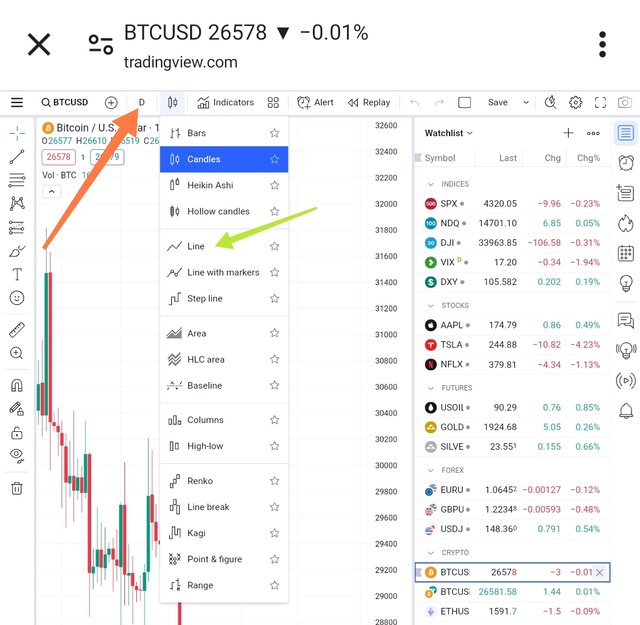
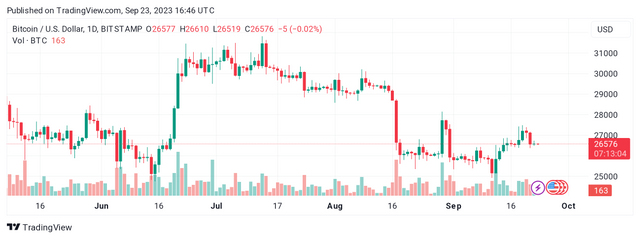
They use Japanese candlesticks on candlesticks chart.This line chart can be applied once you go to a trading platform. Just click on the chart type icon and the select the line charts. This is a pictorial representation of what I'm saying.
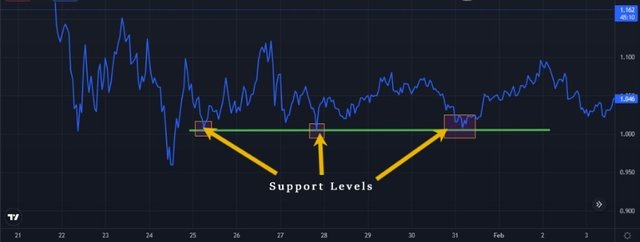
How support and resistance zones can be identified using line charts |
|---|
These two zones are actually the foundation of technical analysis as it helps traders have the idea of what concern the price movement of assets and what may happen next in the market.
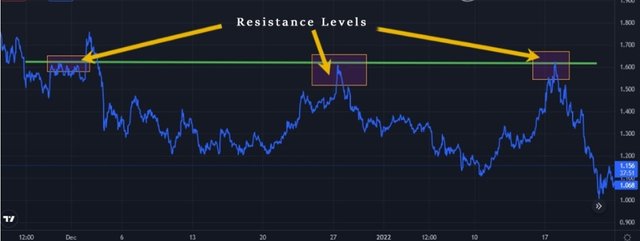
- A resistance level is actually a spot or area where the selling price is strong enough to stop or resist the price of an asset from increasing to a higher position. Resistance level are often found below a previous support level range as shown below.
- A support level which is the reverse of the latter is an area where the buying price is very strong to resist or stop the asset's price from decreasing. It can be found above a previous resistance level range. When a support level is broken, it becomes a resistance area and when a resistance level is broken, it becomes a support level.
To identify this, a trader should identify recent market highs and lows and then connect the market swings which are subjective with a line. If this line includes more swing points, it actually means the two levels are important but if the market breaks these two levels, then traders have to look for an entry price in the direction of the market breaks.
In conclusion, line charts have proven to be an effective strategy as well as other strategies yet to be mentioned. You don't need to check complex candlesticks that may be very difficult to read in terms of price movements and trends. Can this strategy be used in identifying the bullish and bearish market and what are the disadvantages of using this trading strategies? These would be answered soonest.
Disclaimer: Any financial and crypto market information provided in this post was written for informational purposes only and does not constitute 100% investment advice. It's just basic knowledge every crypto trader or investor should have.
https://twitter.com/bossj23Mod/status/1705712852743450911?t=TAxuK45eQ5qLkbhP-OPaDQ&s=19
Dear @bossj23 ,
We appreciate your active participation and contributions to our community. To ensure a positive environment for all members, we have implemented a set of guidelines to maintain respectful and constructive discussions while upholding community guidelines.
This is an interesting post friend, keep sharing quality post although I expect to see conclusion in your post
Now Engage, Connect, and Inspire Each Other to Reach New heights.
Thank You.
Thanks for adding value to my post. It's going to be in the next post