Decoding FTM/Usdt market sentiments across different time frames
 Canvas Edit Canvas Edit |
|---|
Greetings to everyone in Steem Alliance and others visitors. This is me @artist1111 once again . Today, I am once again going to discuss the market sentiments by understanding the price action of FTM (phontom) across different time frames charts.
I am pretty sure that this analysis will provide pretty good highlight the current FTM/USDT market sentiment on 20/06/2024 and potential future movements.
Let's don't wait, jump in by first looking at the weekly time frame, then the daily, and finally the 4-hour chart.
 TradingView TradingView |
|---|
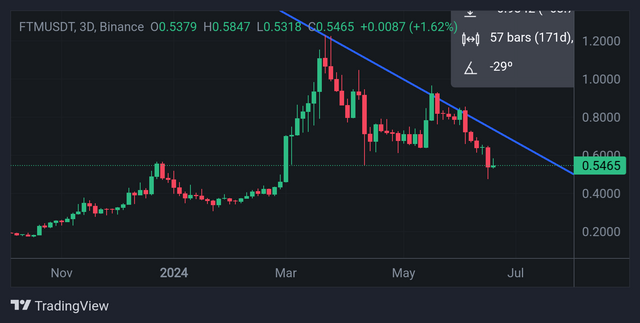
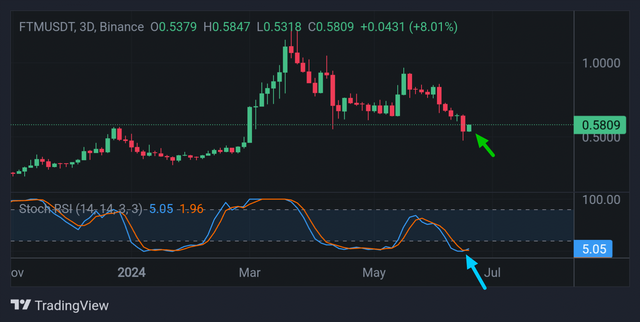
First of all, I opened the 3 Day time frame chart of FTM/USDT to get a broader view of the market structure and trend.
This three-day chart makes it very clear that there has been significant price volatility, with a dramatic drop from the highs of almost $1.2 to the present low of $0.5809. The sequence of lower highs and lower lows, which denote a bearish sentiment, makes this downtrend clear.
The longer lower wicks on the most recent candles indicate some buying pressure, which could indicate support at the $0.5 mark.
 TradingView TradingView |
|---|
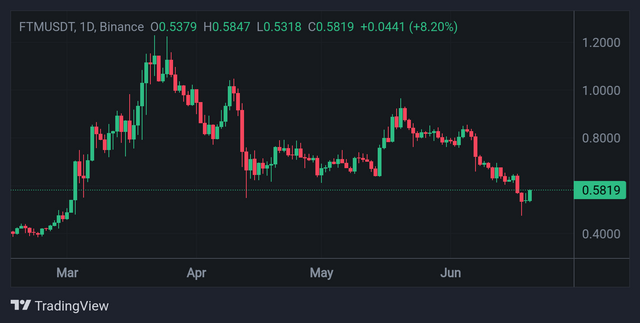
After that, I take a look the daily time frame to understand the more immediate market movements. The daily chart, which shows a steady decline from April to June, also shows the general bearish trend. With a current price of $0.5819, the rise for the day is 8.20%.
This recent upswing might have been a sign of a brief upswing or correction within the overall downward trend. The daily candles are mixed red and green, with some recent bullish momentum indicated by the green candles.
But stronger highs and ongoing buying pressure are required to validate this.
 TradingView TradingView |
|---|
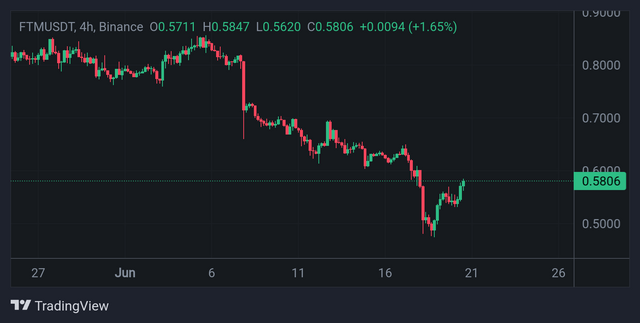
Final time frame take a look is the 4-hour time frame, the chart gives a closer look at the recent price action.
The price created a short-term bottom at $0.50, according to the 4-hour chart, and it has now started to rise, trading at $0.5806. This timeframe forms higher highs and higher lows while giving a clearer picture of the recent bullish momentum.
If it is broken, the immediate resistance level, positioned at or near $0.60, might signal that the short-term uptrend will continue.
 Stochastic RSI indicator "TV" Stochastic RSI indicator "TV" |
|---|
Now finally why not we take a look a Stochastic RSI indicator , I applied the Stochastic RSI indicator on the 3-day time frame chart. The Stochastic RSI shows the current levels of 5.05 (blue line) and -1.96 (orange line), indicating that the asset is in the oversold territory but take a look to the blue line, might its not clear to you people but the blue line crossed the orange line which looks positive sign . .
This suggests that the recent bearish momentum might be losing strength and a potential bullish reversal could be on the horizon as the Stochastic RSI started to move upwards.
The crossover of the blue line above the orange line in the oversold region is be a bullish signal, supporting the possibility of a short-term price increase.
In conclusion, the 4-hour chart reveals a possible short-term positive turnaround, even if the weekly and daily time frames strongly indicate a bearish trend. The notion of a potential upward trend is further supported by the stochastic RSI in the oversold area. However, the price must break through significant resistance levels, especially at $0.60, in order for the trend to remain upward.
Note : This post is made for educational purpose and not as a financial advice.
Kind Regards
@artist1111

Adieu, folks!
May the winds of fortune
carry you to greatness!
May the winds of fortune
carry you to greatness!
X-Promo : https://twitter.com/HamadkhanMWT/status/1803809410692550692?t=9ZZ8DNhG1GwEaTgWWGuz_w&s=19
Note:- ✅
Regards,
@jueco