Technical analysis of the steem price / The steem showing bullish signals in all its indicators

4 days ago I published a very complete analysis of the current steem price trend. I mentioned that we were below a very important resistance at 0.50$, I also said that we should break it in the next days and consolidate above that price and then look for a much bigger impulse to break the next resistance at 0.70$.

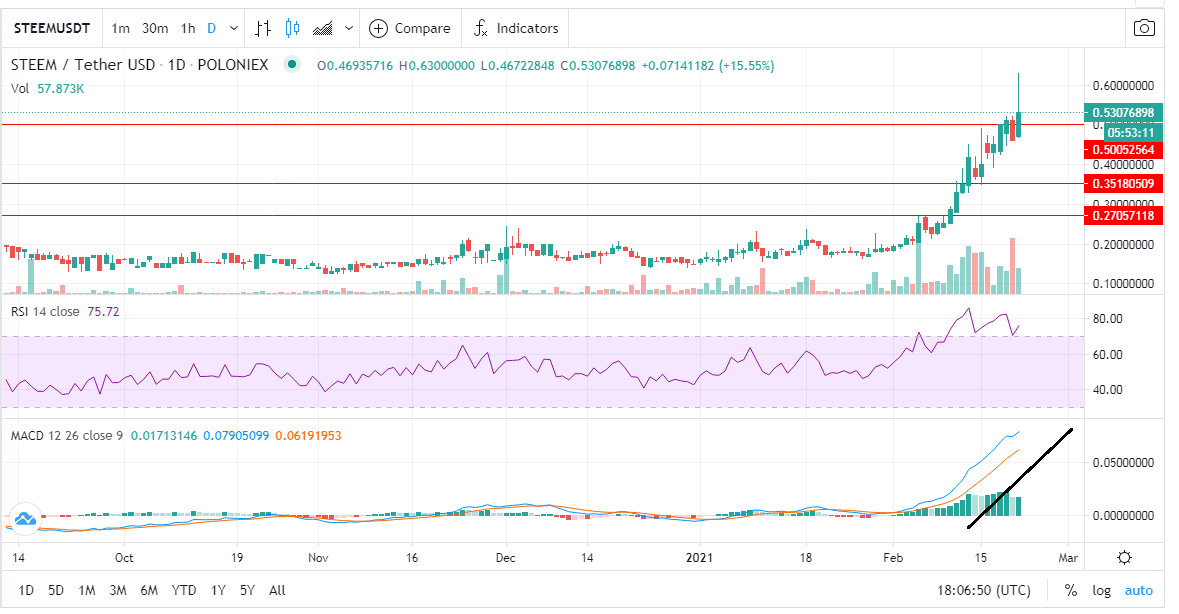
The good news is that a few hours ago we broke that resistance at $0.50 and even the steem reached a price of $0.63, an excellent price rise that brought with it its respective correction and the important thing is that we have not touched the $0.50 support we are currently holding at $0.53, which means that if bitcoin does not correct in the next few hours, it is very likely that the steem will try to break the resistance at $0.70.


After the $0.7 resistance we can easily reach $1.00.
The steem numbers have increased in relation to my last publication, we can observe in the following comparative table:

The trend remains bullish and we are still within the ascending channel as we can see in the chart.

We can also observe this trend in the 1d time frame chart.

If we look at the 40-100 and 200-day moving averages we see that the steem price is above these lines and at the same time these 3 lines have an upward direction which means that the price can continue to increase in the medium and long term.

In the 1h time chart we can see that the price is slightly above the moving averages and at the same time they are pointing upwards, which means that in the short term the trend is still bullish.

The RSI(14) on daily time frame shows us that the price is in overbought level as it is above the 70 range, but currently presents a small bounce at that level (70) which means that the price will continue to rise in the coming hours.

Finally the MACD continues to present bullish signals, as we can see the blue line (MACD) is at the top and above the orange line (signal) and they are in a considerable separation, which means that the price will continue to rise gradually.
But something very interesting can be observed in the MACD 1h time.

The indicator shows a crossover between the MACD and the SIGNAL... what does this mean?
When the blue line crosses above the orange line it is a very bullish signal and that is what the steem is currently showing, then it could mean that in the next hours the price will increase.
Conclusion:
We broke the resistance at $0.5 and fortunately the correction did not reach that level so the steem can continue to gain momentum in order to break above the $0.70 barrier.
The indicators shown in this post show in all cases "bullish signals", which is very positive for the steem.
The volume and market capitalization continues to increase and in the next hours we can have a nice surprise.
Disclaimer
I hope you all liked my analysis and remember that this type of analysis is only a prediction, not financial investment advice.
I hope you all liked my analysis and remember that this type of analysis is only a prediction, not financial investment advice.
I hope you all liked my analysis.
There are significant risks associated with trading. Prices can fluctuate, and the resulting outcome can turn into losses greater than the original investment. For this reason,the creator of this content are not responsible for any loss of assets.
See you in the next post.

