STEEM Market Overview - Technical Review [100% power up]
Hello Steemians, I trust we are doing great today. Today will be reviewing the Steem market to know the current situation of price. I know we are all looking forward to the green days. Nevertheless, we should understand that Steem is just like the rest of the cryptocurrencies in the market with lower dominance. What this means is that Steem will always follow the direction of the crypto market.
Before we dive into our analysis, we will review the global chart to understand the entire direction of the market before analyzing STEEM/USD. This analysis is from the technical perspective and will be carried out on Coinmarket and Tradingview.
Cryptocurrency Global Chart
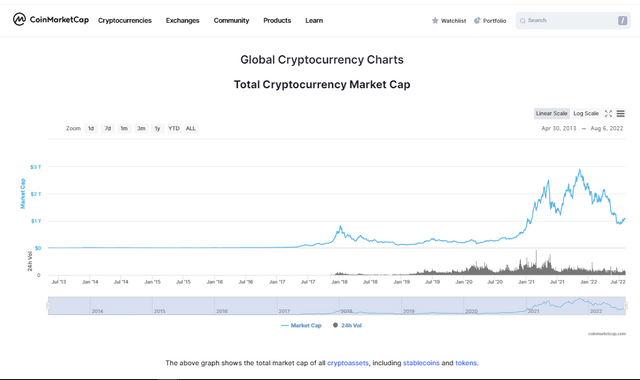
This screenshot was taken at the time of writing this article. The market cap of the entire market is $1.098 trillion with a 24-hour trading volume of $47.78 billion. This is an increase in the last 7 days which of course can be seen in the price of Bitcoin. There are currently 20,472 cryptocurrencies and 500 exchanges according to Coinmarketcap. Bitcoin still dominates the entire crypto market with 40.4%.
Let's look at the Steem Market. Before that, we will be looking at the technical parameters of the Steem market from Coinmarket Cap.
Technical Parameters of Steem
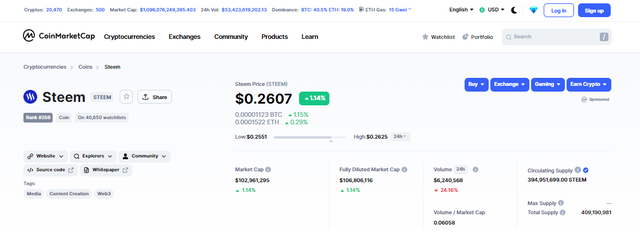
From the screenshot taken from CoinmarketCap, Steem was trading at $0.26 with a +1.3% 24hrs change. The circulating supply of Steem is 394.95k and has a market cap of $102.96 million. Furthermore, Steem has a 24hr trading volume of $6.24 million across all platforms.
Technical Analysis
STEEM/USD Monthly
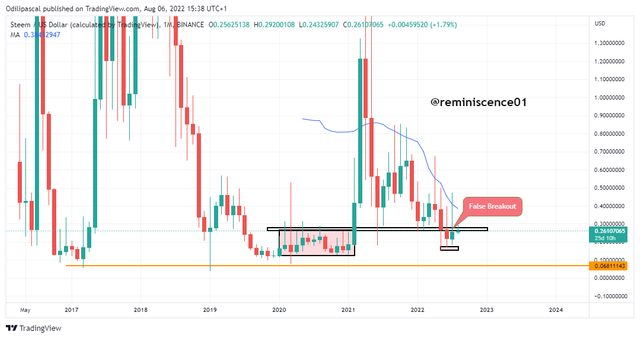
Looking at the monthly chart, we can see a clear price rejection at the resistance. The previous monthly candle broke above the resistance but price still came back down to close below the resistance.
This rejection still shows strong selling pressures back under the resistance. We look forward to the current monthly candle and hope it refills the wick of the previous candlestick. This will see price break above the resistance.
Let's look at the weekly candlestick for a clearer view of price.
STEEM/USD Weekly
From the weekly chart, we can see price better compared to the monthly chart. We can understand the candlestick dynamics in a better position. Now looking at weekly candlesticks, though we have recorded increased higher-highers in the past weeks, price has failed to break above the resistance.
We can see multiple attempts to break the resistance but price still keeps closing below the resistance level. Like I will always say in the previous analysis, the entire market is still bearish as long price remains under the resistance.
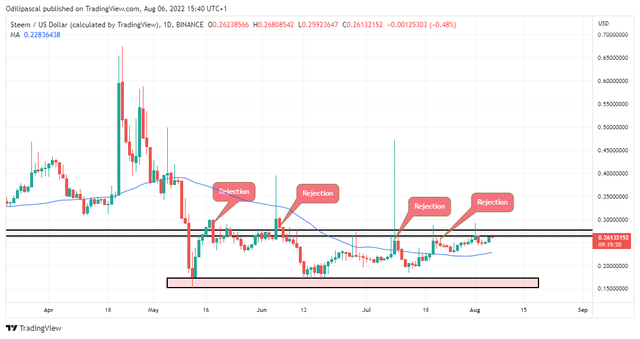
STEEM/USD Daily
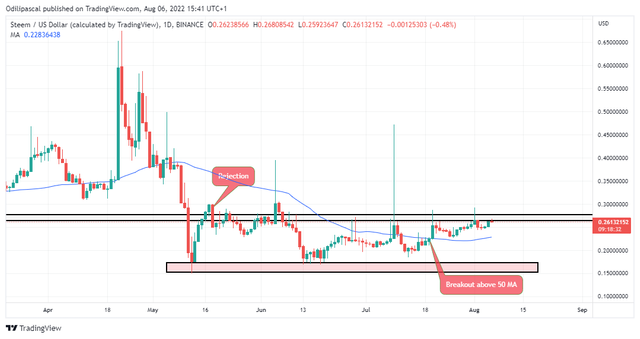
Looking at the daily chart, we can see clear candlestick dynamics. Price has been in a range between $0.26 and $0.17 since May. Though there have been multiple attempts to break above the resistance. This is just a fake breakout by the big players. Sorry if you were caught in the trap.
We are currently looking forward to a breakout above the resistance. We also have another bullish confirmation which is the break above the 50MA. We all know that when price breaks above the MA line, it indicates a bullish reversal.
But this is just signal information. Our main focus is on price action and not the indicator. We can confirm a bullish reversal on Steem when price breaks above the resistance level.
From the multi-timeframe analysis carried out, we can be able to predict the possible price movement of Steem.
Predicting the Next Direction of STEEM/USD
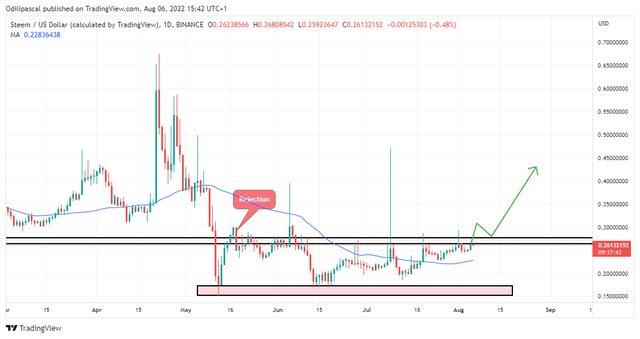
The chart above shows the first possible price movement of Steem. From my observations, this is likely to hold with the current price movement. Nevertheless, we should be careful not to get caught up in another fake breakout. I have explained how to identify true breakout in the previous analysis.
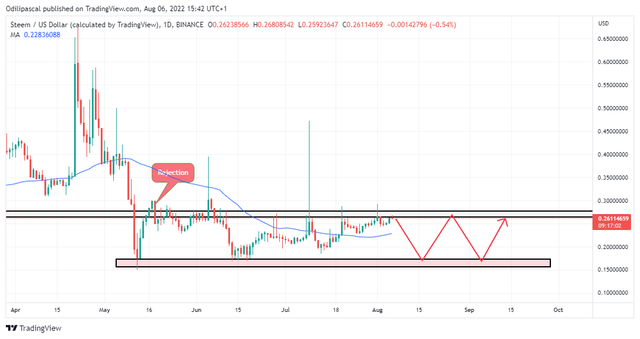
The chart above shows the next possible price movement. We can remain in this range with price bouncing off support and resistance. We have been in this circle for a couple of months and price will remain in this range until high volumes in injected into the market.
I'm positive about Steem from the technical perspective. However, we should only react to price movement and not based our investment decisions on assumptions and predictions.
Note: This analysis is based on my personal opinion and knowledge. This is for educational purposes and not a piece of investment advice. Please do your own research and invest what you can afford to lose. The crypto market is highly volatile and risky.
Cc: @reminiscence01
Good work my dear friend its a great information for those who are new in the crypto market
Thank you, dear. I hope you will follow my blog for more of this analysis.
This is one of the best analysis I have ever seen, let's keep doing our very best and ensure that the price of steem goes up. More power up and less or if possible no withdrawal.
Thanks for the education.
Note: You must enter the tag #fintech among the first 4 tags for your post to be reviewed.