Steem Account Distribution - owned and effective SP [burnsteem100]
Here's a way of looking at Steem's account distribution that I haven't seen posted elsewhere. How are people using delegations to realign their accounts?
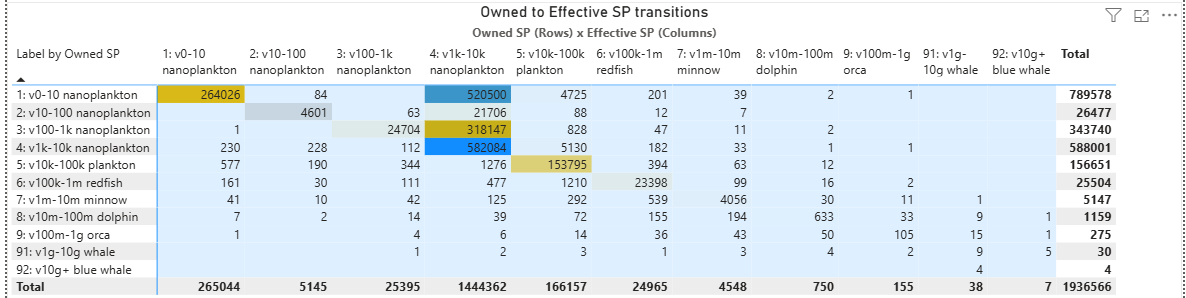
Breaking the table down, it has three sections:
- The top-left to bottom-right diagonal is the number of accounts that don't change class by delegation.
- The lower-left triangle are the number of accounts that drop down in class after factoring in delegations (i.e. Whale to Nanoplankton)
- The upper-right triangle counts the accounts that gain in size by delegations. (i.e. nanoplankton to orca).
Understanding the graph (by example): If you look at the "4" in the bottom row, 2nd column from the right, that tells us there are four blue whale accounts who downsized to whale accounts after applying delegations. Similarly, if we look at the "whale" row, we can see that 5 accounts have upgraded to "blue whale", 9 accounts have stayed in the same class, and about 16 have downsized to various classes.
The shading of the cells is supposed to reflect the number of accounts. Unsuprisingly, the great majority of all accounts are in the [nanoplankton -> nanoplankton] or [plankton -> plankton classes].
Overall, I suppose the dominant trend is minnows, dolphins and orcas delegating to build higher-classed accounts:
- By ownership, we have 30 whales and 4 blue whales.
- By delegation amount, we have 38 and 7.
- The number of minnow accounts is 5,147 by ownership, and 4,548 by delegation.
- Dolphins are 1,159 by ownership vs. 750 after delegation.
- Orcas go from 275 by ownership to 155 after delegation.
And here are the equivalent values in SP (at today's value near ~605 STEEM per MVEST):
| Min Vests | Min SP | Label |
|---|---|---|
| 0 | 0.00 | Nanoplankton |
| 10 | 0.01 | Nanoplankton |
| 100 | 0.06 | Nanoplankton |
| 1,000 | 0.61 | Nanoplankton |
| 10,000 | 6.05 | Plankton |
| 100,000 | 60.52 | Redfish |
| 1,000,000 | 605.20 | Minnow |
| 10,000,000 | 6,052.03 | Dolphin |
| 100,000,000 | 60,520.30 | Orca |
| 1,000,000,000 | 605,203.00 | Whale |
| 10,000,000,000 | 6,052,030.00 | Blue Whale |
| 100,000,000,000 | 60,520,300.00 | Blue Whale |
| 1,000,000,000,000 | 605,203,000.00 | Blue Whale |
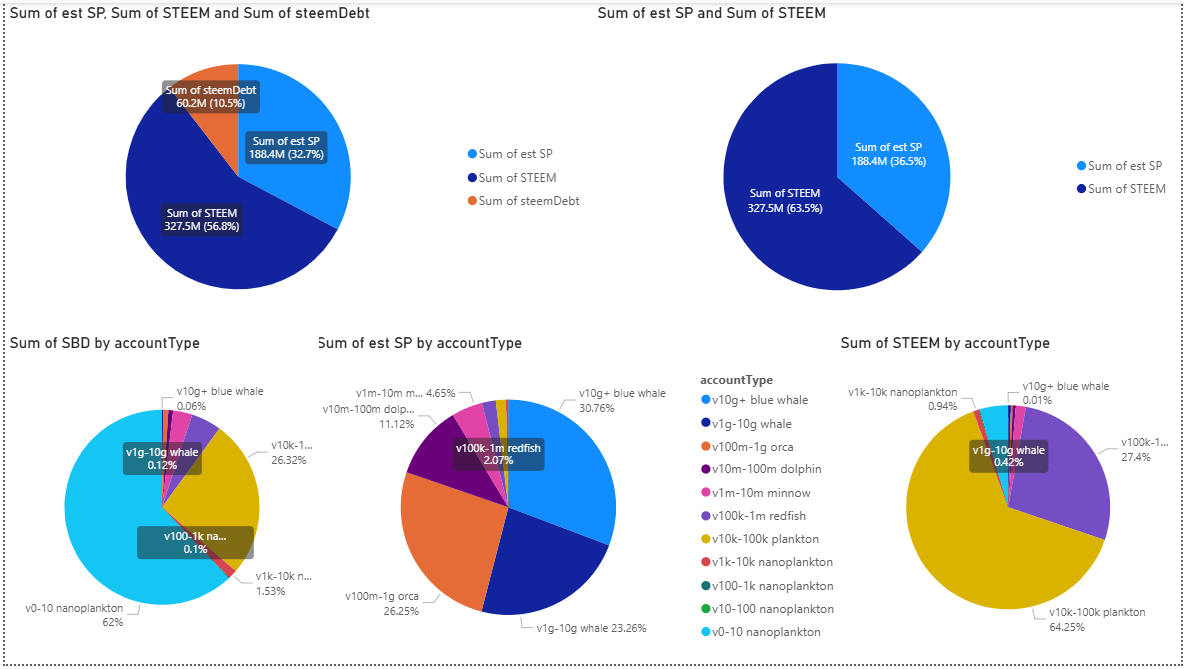
And as long as I updated the PowerBI, here are some other visuals, posted without explanation.
Distribution of STEEM, SP, and SBD based on account classification (label)
Distribution of STEEM, SP, and SBD based on effective (post-delegation) account classification (label)
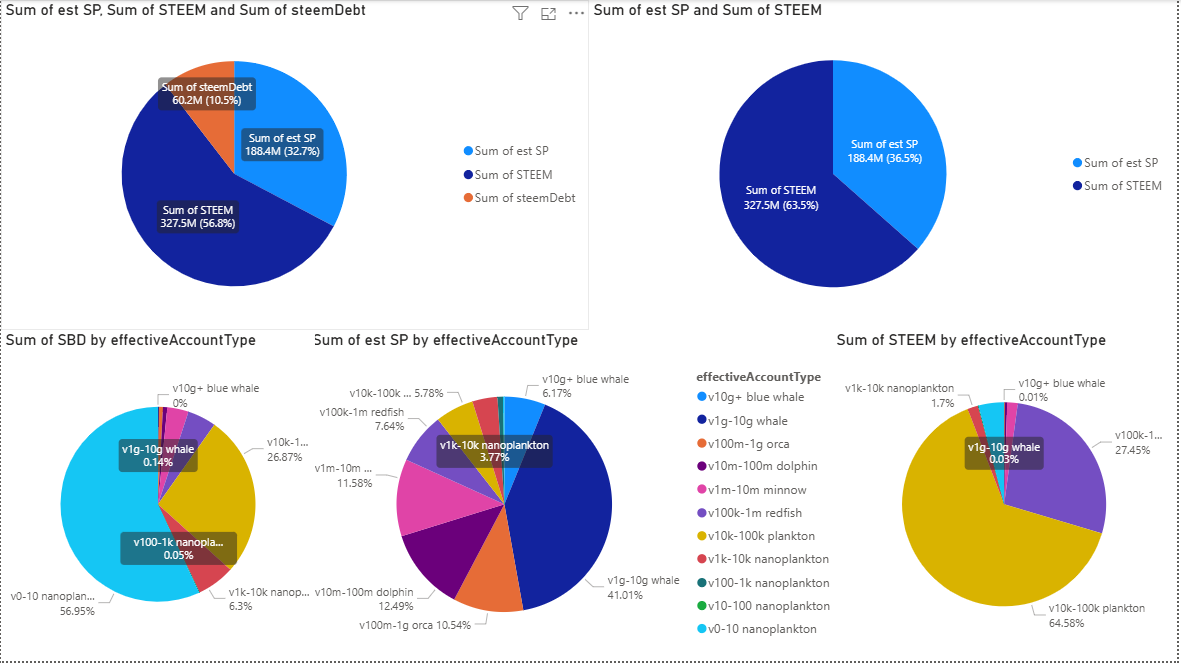
- Note that almost 50% of all SP is controlled by (owned by or delegated to) Whale/Blue Whale level of voters (of which there are 45).
- Not quite 82% of all SP is controlled by Minnow and above level accounts (after delegation), which is 5,498 accounts (0.28% of all accounts).
SP control by voting bots
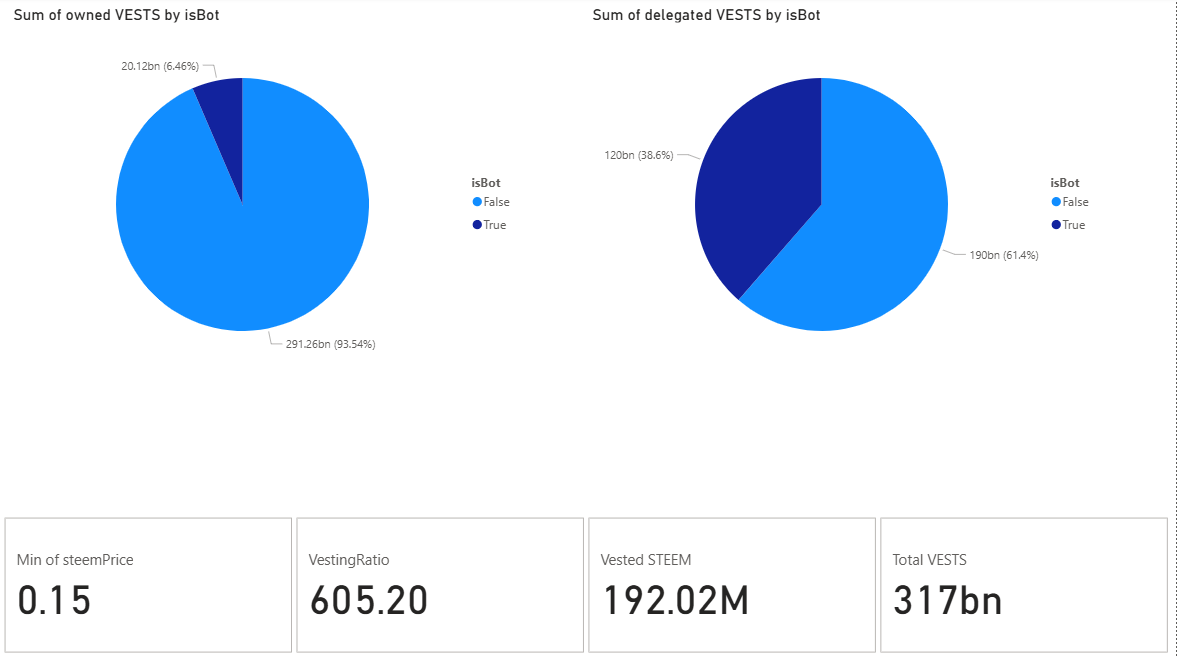
- Since the first time I looked at this, it appears that the bot ownership stake has increased by about 2%, but the effective SP is down by about 1%. At first glance, I guess that's sort-of a healthy change...