Grassroot Crypto Education | Series 2 Volume 3 - Introduction to Technical Analysis (First Part)
What is your understanding of Technical Analysis?
Technical analysis is the practice of analyzing financial charts in order to predict future movements. Typically, technical analysis is used to identify patterns in price action that can indicate profitable opportunities. Technical analysts also use indicators to help identify potential support and resistance levels, as well as trend lines.
Some common technical analysis tools include the moving average, Bollinger Bands, Fibonacci retracements, and Ichimoku Cloud.
Predicting future movements in prices
Technical analysts use technical analysis to identify patterns in price action that can indicate profitable opportunities. For example, if you see a stock trading at $10 per share and the moving average is at $8.50, it may be worth buying the stock since the moving average suggests that there is potential for a rally up to $9 per share. Technical analysts use charts, general understandings of market behavior, and indicators to help make informed decisions about when and where to buy or sell stocks.
What is importance of technical analysis?
Technical analysis is a valuable tool for anyone who wants to make money in the stock market. However, it is not a guarantee of success and should only be used as part of a comprehensive investment strategy. Technical analysis is not 100% accurate, but it can provide valuable information about the direction of the market. Technical analysis can help you identify patterns in price action that indicate where the market is headed.
- Technical analysis can help you identify patterns in price action that indicate where the market is headed. This information can be valuable for making informed decisions about when and where to buy or sell stocks.
- Technical analysis can be a valuable tool for gauging market sentiment. When the market is moving in a particular direction, it may be wise to invest early in order to take advantage of the trend.
- Technical analysis can help you spot opportunities to trade on short-term trends or movements.
- Technical analysis can help you cope with the loss if the market goes down . By understanding where the market is likely to go, you can make better decisions about when to sell and avoid costly mistakes.
- Technical analysis can help you identify overvalued or undervalued stocks. By doing this, you can make better decisions about when to buy and sell stocks. However, technical analysis should not be used as the only factor in making investment decisions.
Explain Bull and Bear Markets in Cryptocurrency.
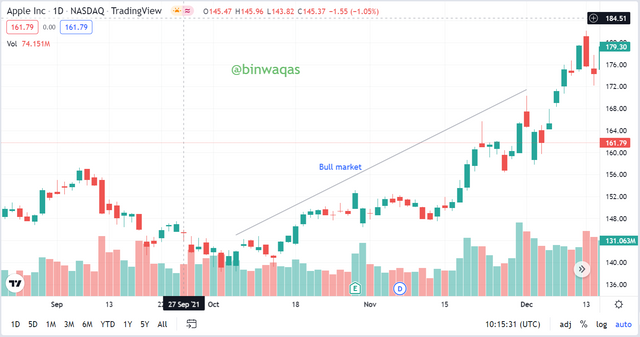
Bull market in cryptocurrency: A bull market is a period of time where the price of a cryptocurrency rises rapidly. This can occur when there is an increase in demand for the cryptocurrency, indicating that people are bullish on its future . During a bull market, the price of a cryptocurrency is likely to rise above its previous price.
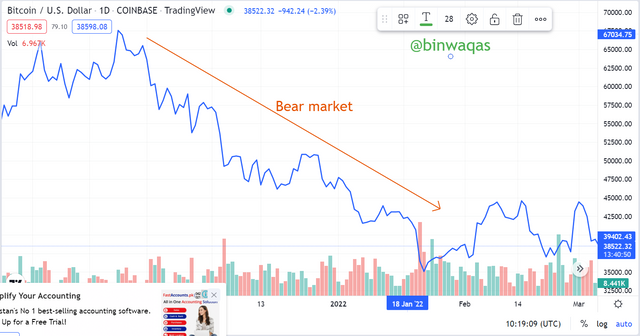
Bear market in cryptocurrency: A bear market is a period of time where the price of a cryptocurrency falls rapidly. This can occur when there is an increase in supply of the cryptocurrency, indicating that people are bearish on its future . During a bear market, the price of the asset will be below the previous price.
What are Support and Resistance?
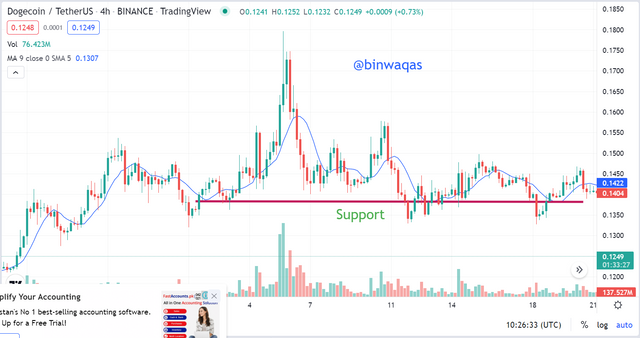
Support: Support is a technical term used in the stock and forex markets to indicate a level of price at which buyers and sellers are willing to continue trading. If the price falls below this support, most traders believe that there is strong demand for the asset and will purchase it, pushing up prices. Conversely, if the price rises above this level, most traders believe that there is limited demand and will sell off their holdings, depressing prices.
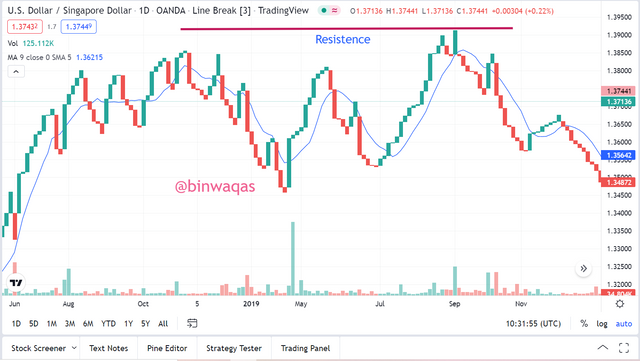
Resistance: Resistance is a technical term used in the stock and forex markets to indicate a level of price at which buyers and sellers are unwilling to continue trading. If the price rises above this level, most traders believe that there is strong demand for the asset and will purchase it, pushing down prices. Conversely, if the price falls below this level, most traders believe that there is limited demand and will sell off their holdings, depressing prices.
Note: You must enter the tag #fintech among the first 4 tags for your post to be reviewed.