FOREX ANALYSIS| XAUUSD | 22-26 July 2024 |

Welcome to Forex Insights, Your Gateway to Smarter Trading! Today we will be analyzing the XAUUSD currency pair for the week of 22-26 July 2024
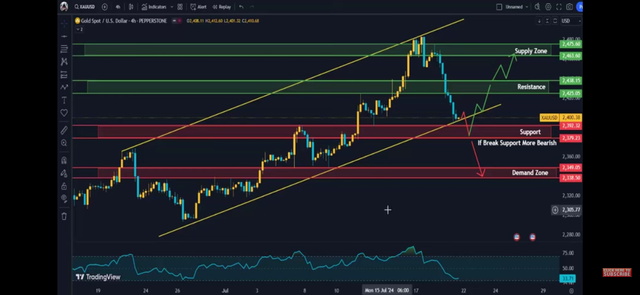
On the 4-hour time frame, the chart shows an overall uptrend but with recent bearish corrections. A break below the support level could indicate further bearish movement towards the demand zone. Conversely, holding above the support or a bounce from the demand zone could lead to a resumption of the uptrend.
The XAUUSD pair is in an overall uptrend but is currently experiencing a bearish correction. Key levels to watch include the support at 2392.32 and the demand zone between 2349.05 and 2338.50. A bounce from these levels could resume the uptrend, while a break below could lead to further bearish movement.
The supply zone is 2475.60 - 2463.60. The price previously reached this zone and experienced resistance, leading to a decline. If the price ascends to this area again, it's likely to face significant selling pressure.
The resistance level is 2438.15. This is a crucial level where the price has faced resistance before. Breaking above this level could lead to a bullish trend towards the supply zone.
The support level is 2392.32. The price is currently approaching this support level. If the price holds above this level, it may bounce back towards the resistance.
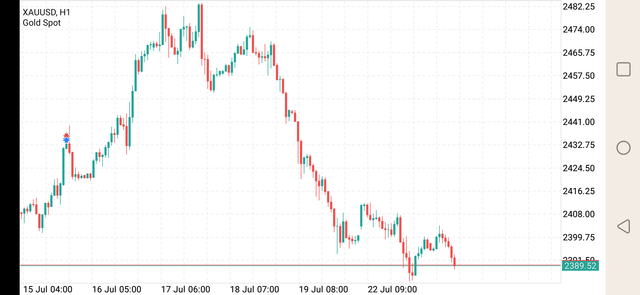
On the 1-hour timeframe, The pair is in a short-term downtrend, approaching a critical support level of around 2389.52. The next movements will depend on whether the price finds support here or continues to decline. Monitoring RSI and other indicators will provide additional insights into potential reversals or continuations.
The price is currently trading around 2389.52, close to the support level observed in the 4-hour time frame. Observing price action around this level is crucial for determining short-term movements.
If the price finds support around 2389.52 and forms a bullish reversal pattern, it could move back toward the recent highs leading to a bullish scenario. On the other hand, If the price breaks below 2389.52, it could continue its downtrend toward the next support levels identified in the 4-hour chart leading to a bearish scenario.