[Technical Analysis] SUSHI/USD Market November 21, 2022
Hey Guys..!!
Meet again with me Wahyu Nahrul, This time I want to make a brief technical analysis of a cryptocurrency chart, the analysis I made is based on my experience and knowledge.
.png)
Alright, let's get straight into the discussion, happy reading!!

Sushiswap (SUSHI) Analysis
Today, November 21, 2022, I will try to technically analyze the price movement of Sushiswap.
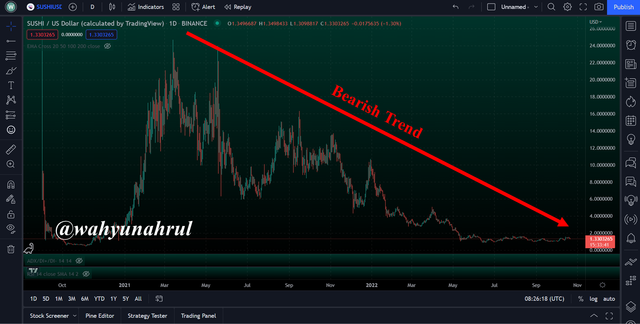
If we look at the price movement of SUSHI in general, we can see that SUSHI is in a very deep bearish phase. We can see this in the SUSHI price movement pattern in the chart above where the candlestick tends to move downwards if we look closely.
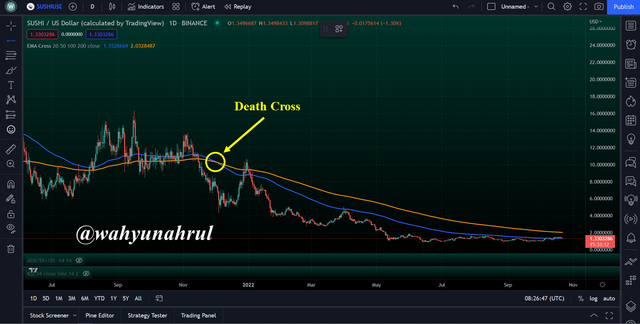
This is also shown and confirmed directly by the EMA indicator where there is a cross between the 100 and 200 EMA lines where the 100 EMA line moves above the 200 EMA line.
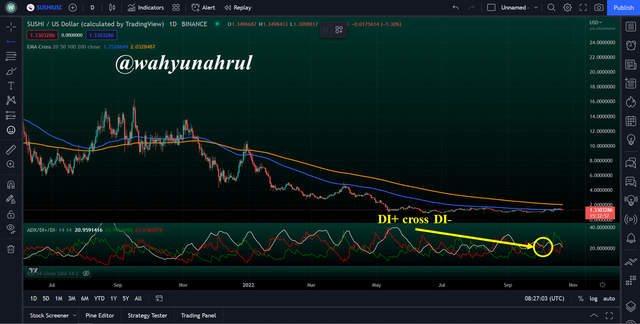
But the opposite is shown by the ADX indicator where there is a bullish signal with the occurrence of a Golden Cross between DI+ and DI- this is a very positive sentiment.
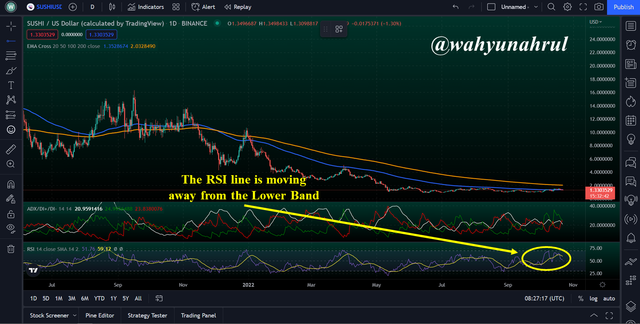
In addition, the RSI indicator also strengthens the signal given by the ADX indicator where the RSI line is starting to move upwards toward the Upper Band and this is a very positive thing for the SUSHI/USD market.

Disclaimer: