[Technical Analysis] MATIC/USD Market March 06, 2023
Hey Guys..!!
Meet again with me Wahyu Nahrul, This time I want to make a brief technical analysis of a cryptocurrency chart, the analysis I made is based on my experience and knowledge.
.png)
Alright, let's get straight into the discussion, happy reading!!

Polygon (MATIC) Analysis
Today, March 06, 2023, I will try to technically analyze the price movement of Polygon.
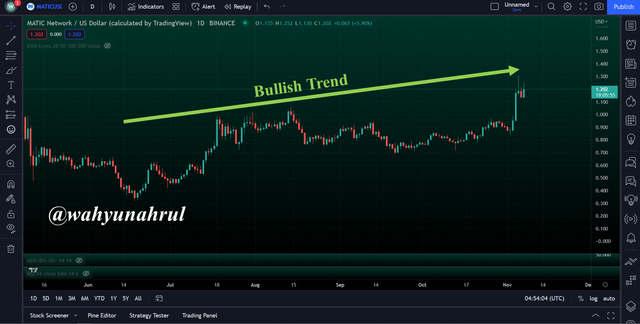
If we look at the price movement of MATIC in general, we can see that MATIC is in a bullish phase. We can see this in the MATIC price movement pattern in the chart above where the candlestick tends to move upwards if we look closely.
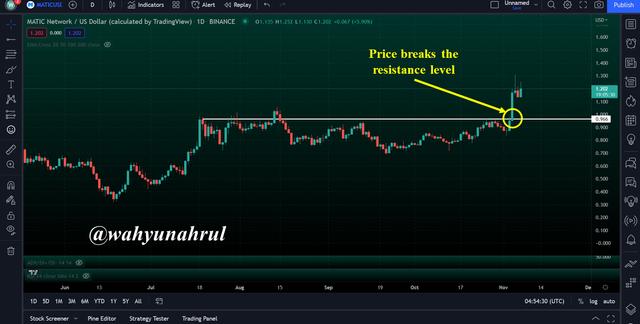
The chart above also shows that the current Bullish Trend in the MATIC/USD market will continue for the next few days because the MATIC price has already penetrated the Resistance Level.
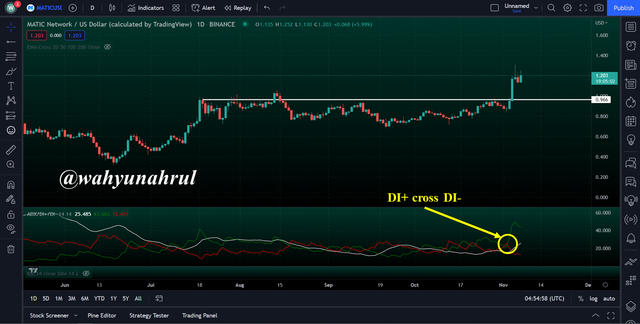
Further confirmation was also given by the ADX indicator with the presence of a cross between the two DI lines where the DI- line moved below the DI+ line.
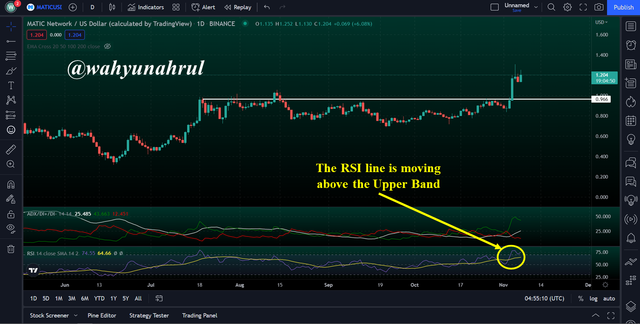
The RSI indicator also shows the opposite where the RSI line is starting to move away from the Lower Band, which signals that the oversold phase is over and the market is passionate about buying MATIC again.

Disclaimer:
not bad Look at my opinion on it, too