Crypto Chart 11/2021 Review II BTC-USD
Peace
I hope you are doing well this morning. The price of the token presented below on the weekly chart is reviewed in a brief report. It is important to never invest more than you can afford to lose. The opinions given in this article are only for educational purposes. Please I strongly stress the point of conducting your full detailed research on the crypto you are targetting before any action in this volatile market.
--

--
--
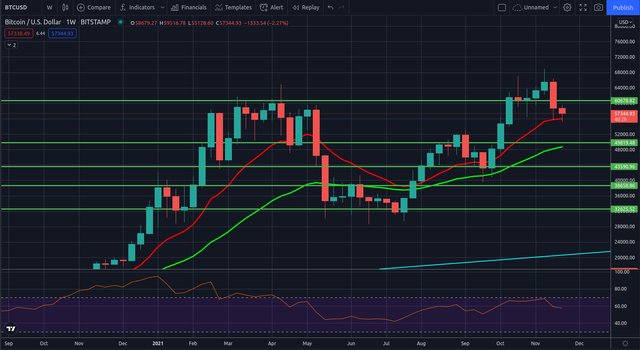
The price on the weekly chart describes the evolution of Bitcoin tokens against USD one candle at a time on the exchange. The prices of BTC are moving down since last week. Its current value is located as I am writing this article around 57271 USD. The green line represents the resistance line that was crossed on the way down. The fact that BTC price candle crossed this resistance line revealed the large volume of sales orders completed on the market. The moving average has crossed on the weekly chart. Therefore, we should see a downtrend in prices. The moving averages have confirmed the trend and only the volatility of the market should make a difference. I expect the market will react and curve this downtrend in value. Otherwise, hold your bag of BTC as the prices dive.
Thanks for reading this post and spending some time exploring content available on the blog page.
If you haven't played Splinterlands, check-in for free here my referral links
The official telegram group Splinterlandstelegram
--


Please share with us in the comment section whatever suggestions or questions you would like me to consider for the improvement of this series of crypto prices analyses.
Warm regards
--
Thanks