Index trading - US30 - 11-23-21 - Support area?
Hi fellow Steemians.
Today I will post my #chartanalysis for the US index usually known as #US30 or #DJ30 depending on the #broker.
My recommendation as always is to start the day (analysis) with a fresh, clean chart with only mayor levels marked up.
Start with the daily chart, then the weekly to see if there is congruence on what we are seeing, then review the daily chart.
So with this we can start.
The daily chart as NY closed today 11/22/21 looks like this:

With this we can observe that we are at a decision point. One previous resistance became support on previous days.
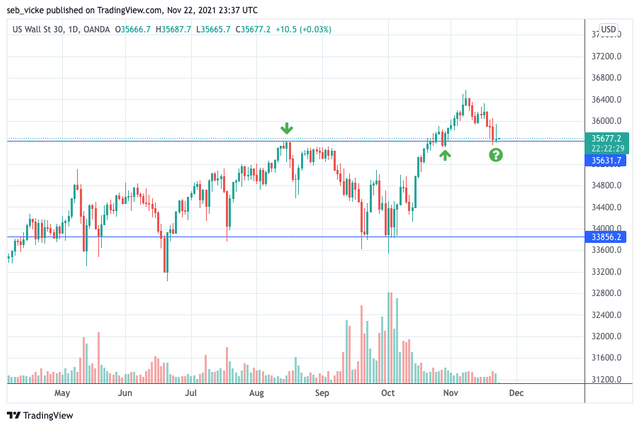
We have 2 levels marked.-
Upper level - 35630 area
Lower level - 33850 area
Now we will see the WEEKLY #chart
From the lowest point after the #Covid #FUD sellout in March 2020 we start seeing recovery in April 2020.
We also notice that we had a previous ATH (all time high) of 29583 points (quite lower from where we are now).
Also we can notice that the ascending channel hasn't been broken yet.
IMPORTANT - THIS IS NOT FINANCIAL ADVICE AND THIS IS ONLY MY OPINION OF WHAT COULD HAPPEN, NOT A SELL OR BUY ADVICE.
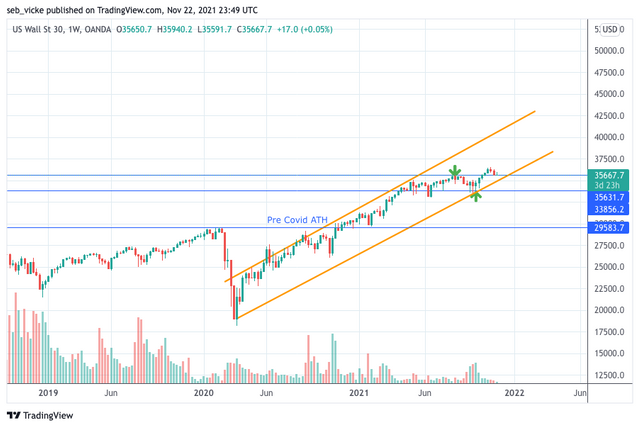
We can see that in the weekly chart we are at a correction and is perfectly timed with the inflation reports and the #FOMC report and de price index reports are released on Wednesday, so we have uncertainty in the markets right now.
Returning to the Daily chart and taking into account previous statements, we can expect a deeper pullback to test the trend line or the middle range support before it can go up depending on the released reports on Wednesday.

These are the bullish scenarios, but we need to be careful if the support is broken even for the deeper pullback. I would expect this support to hold even with the way today's candle close.
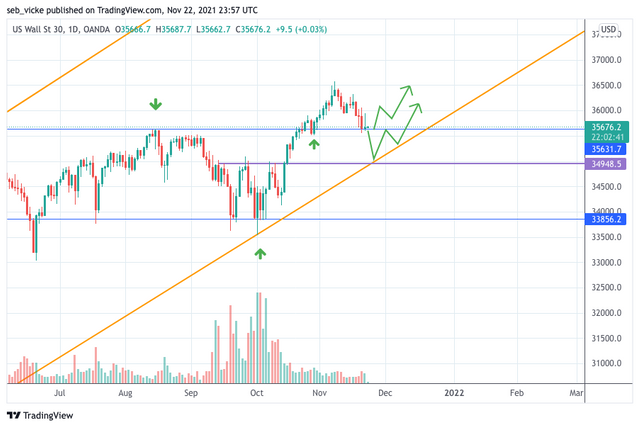
The bearish scenario would need bad news for the economy and a break and retest of previous support confirming a resistance.

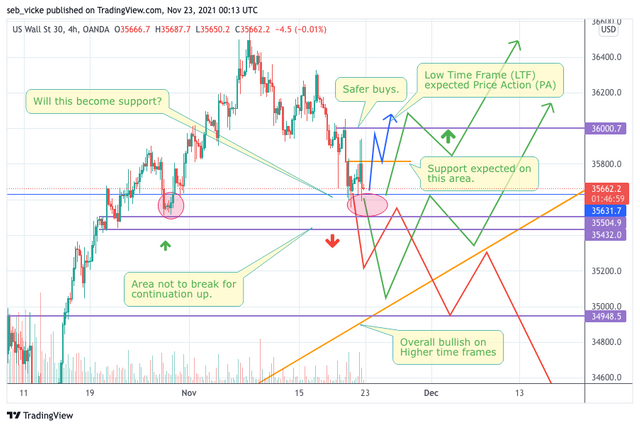
We can expect a pullback for today to the 35500 area, but still those would be high risk buys. For less risky buys I would expect a 4hr candle body above 36000. Sells below 35400 to retest the trend line and previous support.
But remember that US30 have strong moves and more during news so always trade carefully.
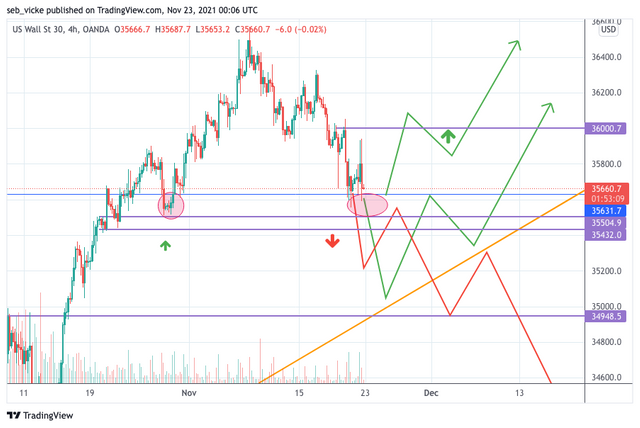
On the lower time frames I hope to see something like this, but until London open we won't have clear direction.
*Asian usually don't have heavy moves for US indexes.