Verge Coin (XVG) Is Ready For Breakout
Hey, friends hope you are well and welcome to the new update on Vergecoin. In the previous article, I shared two patterns of the XVG coin. First was the bullish Shark that was formed in the US dollar market and the other one was the bullish BAT that was formed in the Bitcoin market as below:
XVG with US Dollar pair:

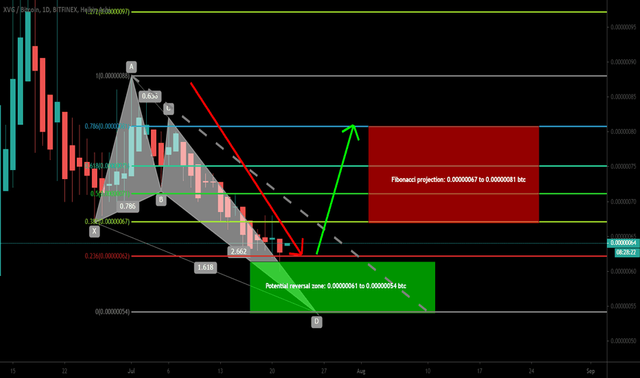
XVG with Bitcoin pair:
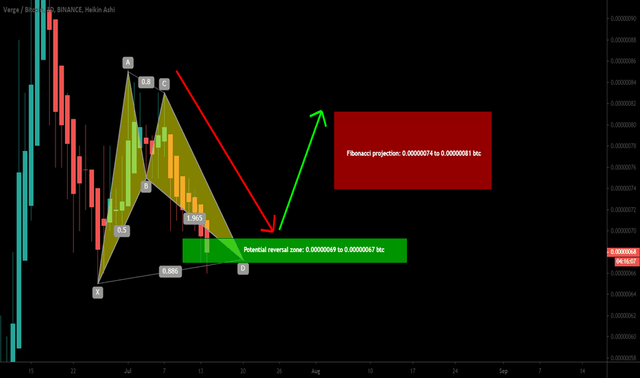
The Shark pattern is moving as planned but on the other hand in BAT pattern that was formed with Bitcoin pair the price action broke down the support of the potential reversal zone of formed the bullish butterfly as below:
Now the targets with the US dollar pair are the same as I mentioned in my previous article but the targets with the Bitcoin pair are changed. Therefore I am sharing the revised target again as below:
XVG with Bitcoin pair:
Potential reversal or buying zone: 0.00000061 to 0.00000054 btc (this should be stop loss as well)
Fibonacci projection or sell: 0.00000067 to 0.00000081 btc
XVG with US Dollar pair:
Potential reversal or buying zone: $0.0062 to $0.0058 (this should be stop loss as well)
Fibonacci projection or sell zone: $0.0066 to $0.0075
Now if we watch on the daily chart and place simple moving averages with the time period of 25, 50, 100 and 200. Then it can be seen that price action broke down the 25 simple moving average and now it is likely to move up again. I am waiting for the 100 simple moving average to cross up 200 simple moving average because this bull cross can produce more powerful rally the upside.
If we watch the different support and resistance levels on 2-day chart. Then the price action is at the support of $0.006 and after this support, the next support level is at half-cent. The price action is moving on this supports since 13th of July and now finally it is gearing up. And it can move up to the next resistance at $0.0075. In case of breaking out the resistance level, the next resistance level can be at $0.0085, and then we have the key level resistance at one cent.
The priceline can make another attempt to breakout the cloud:
Now I would like to draw your attention towards the weekly chart. Where the priceline has already made a powerful attempt to break out the Ichimoku bearish cloud. At this time the priceline of Verge coin is moved down in the middle of this cloud and as we have seen that the protection on the daily chart has formed the different harmonic patterns and ready to move up. Therefore we can expect that soon the priceline can also make another attempt to breakout this bearish cloud as well. And once this cloud will be broken out then it can become a powerful support level for the priceline of XVG on the long term.
Click here to create free account on tradingview to watch and play the chart on realtime
Conclusion:
Price action of Verge coin has formed different harmonic patterns on the daily chart and also at the middle of the ichimoku cloud on the weekly chart. And it has also confirmed the bullish rally that can be started soon. But for stop loss purpose we can use the potential reversal zones of the harmonic patterns that I have shared above in order to minimize the risk factor.
Note: This idea is education purpose only and not intended to be investment advice, please seek a duly licensed professional and do you own research before any investment.